
Your projects at a glance
Every repository you've opened or discovered shows up here, grouped into sections — open tabs, favorites, recently used, everything else — each as a row with its branch and working-tree state at a glance. A repo's own README lives in the same right-hand slot the AI daily briefing uses (covered on its own page), so a card can be read without opening the repository itself.
Pinning a project keeps it at the top of the dashboard
Starring a repository's row adds it to its own Favorites section, ahead of Recent and All — the fastest way back to the handful of repositories you actually work in day to day, out of everything the dashboard otherwise lists. Its README opens in the same right-hand panel a repository's AI daily briefing would use.
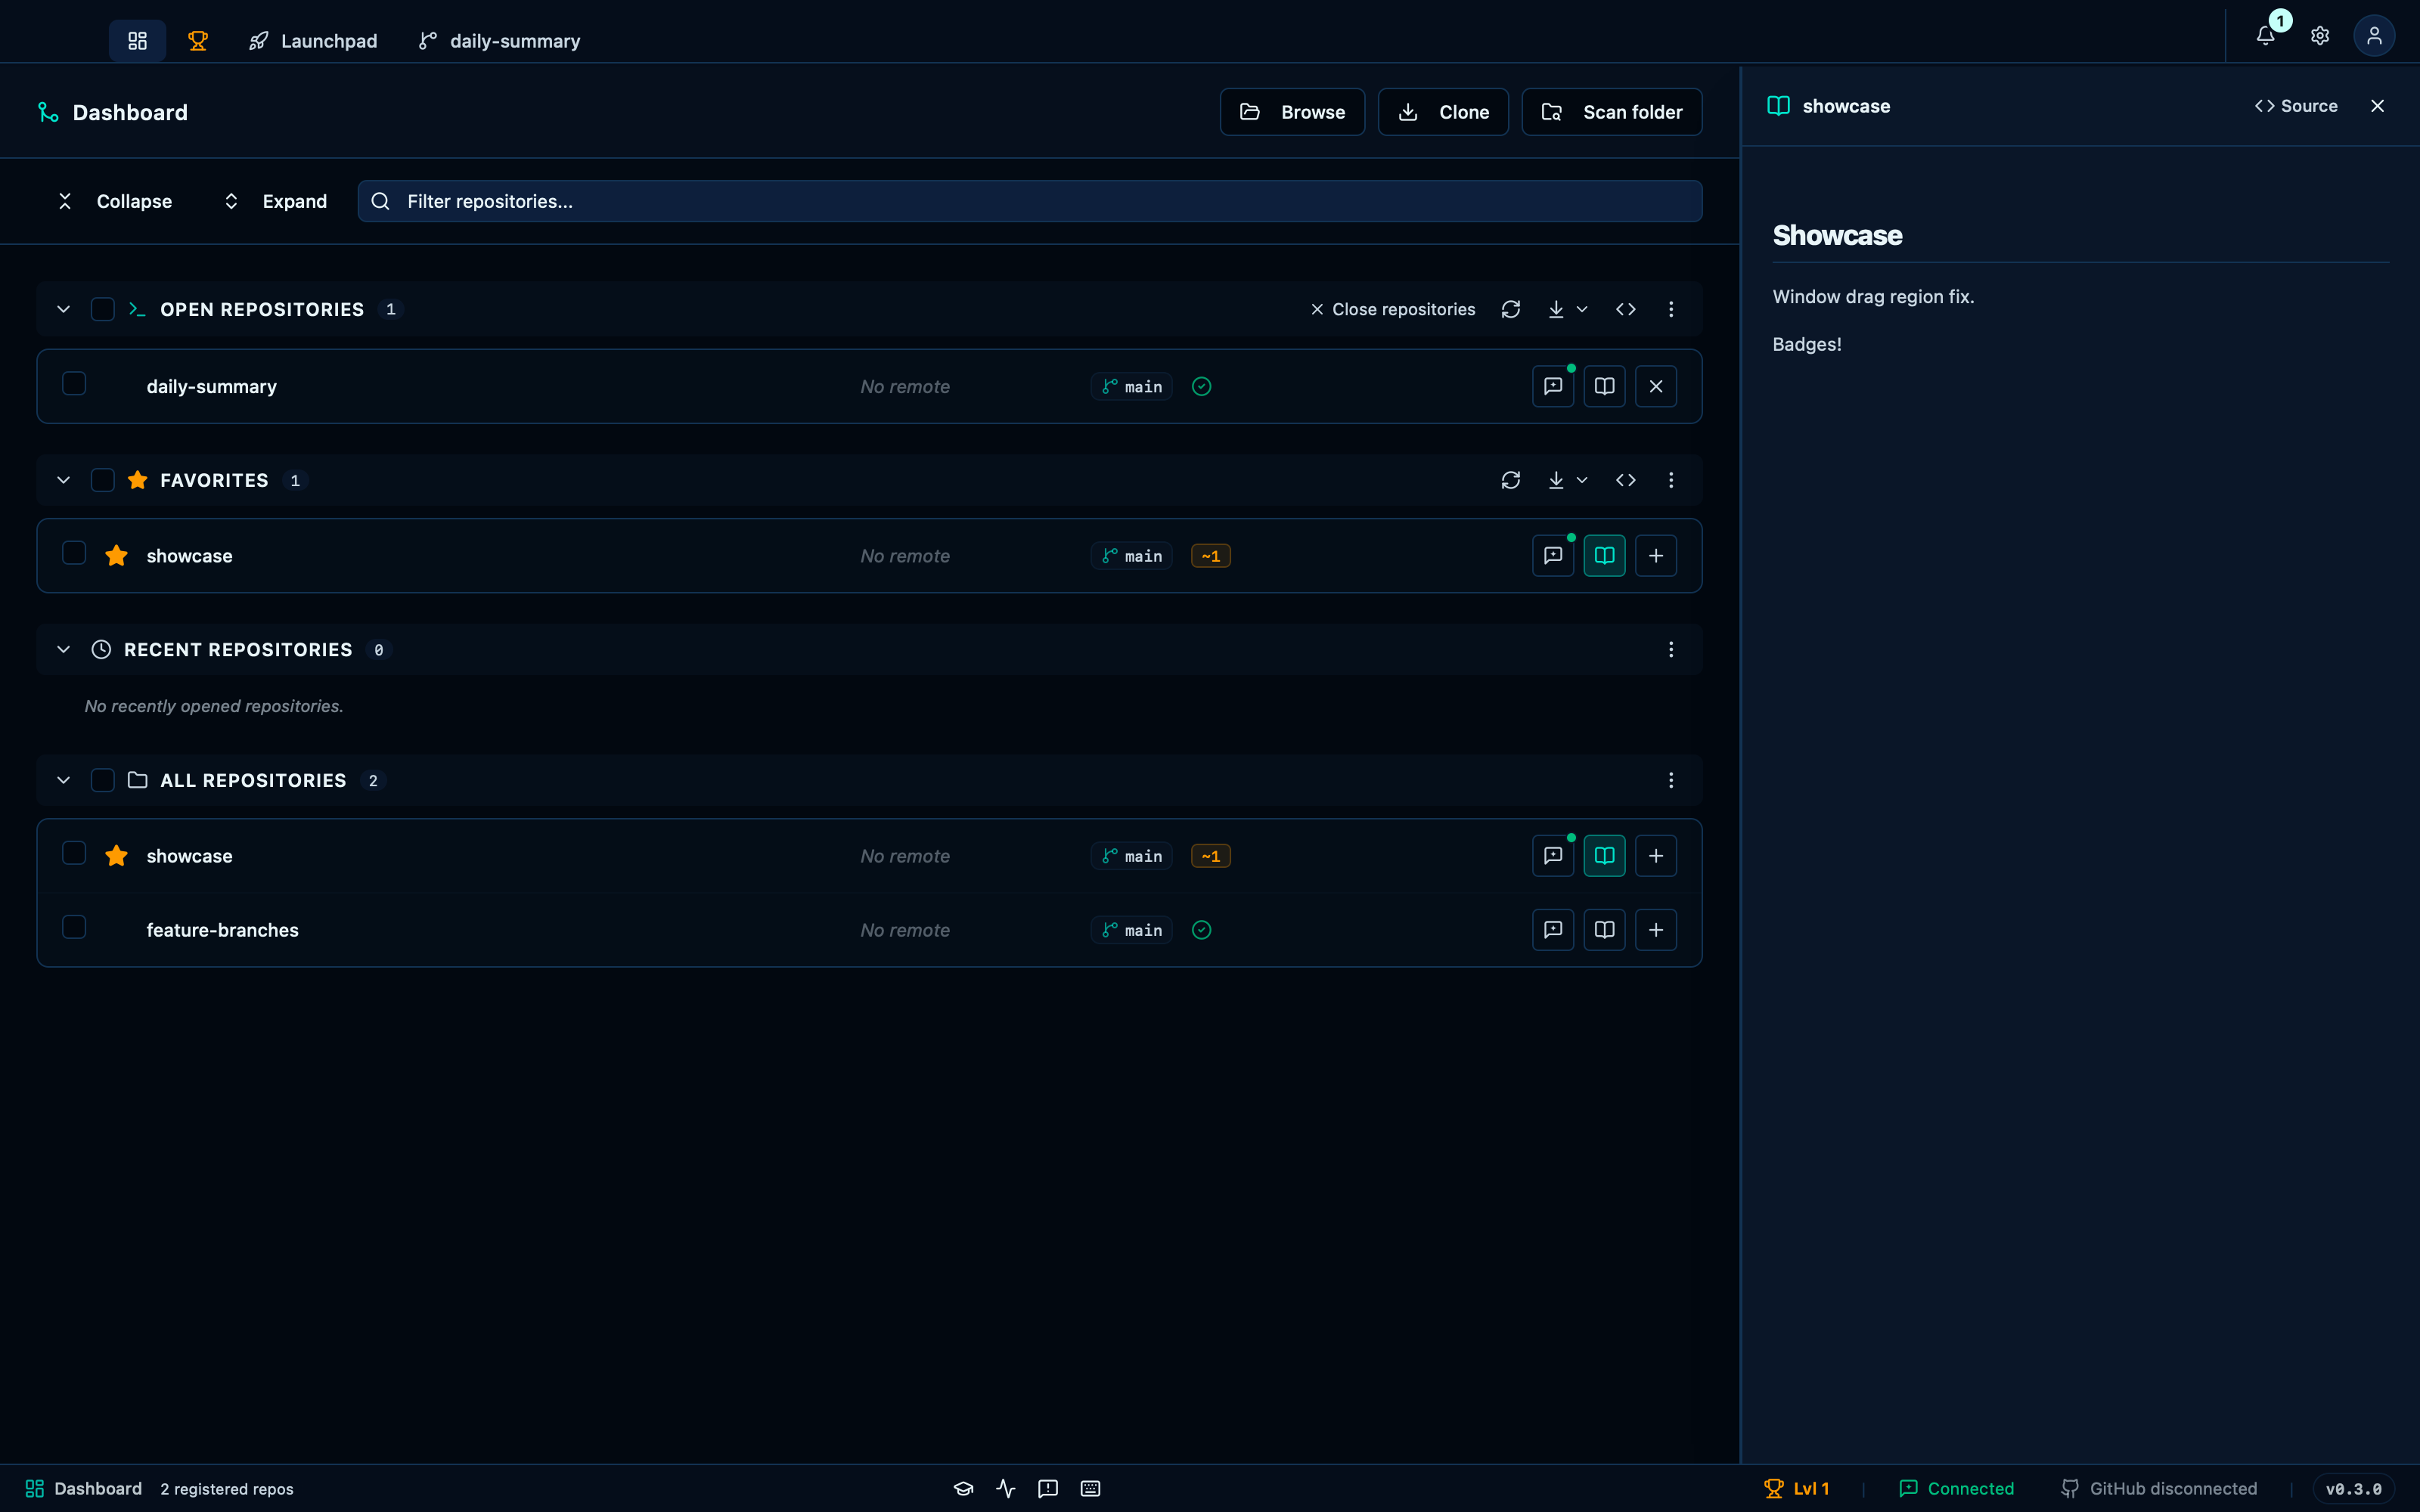
Captured from the running app by this scenario.
Do this
- Open the dashboard
- Pin the
showcaseproject - Open the
showcaseproject's README
You should see
- The
showcaseproject is in the favorites section - The README panel is shown
Reading a project's README without opening it
The README opens in the dashboard's right-hand panel, rendered, so a project can be identified — or its setup steps followed — without opening the repository at all. The toggle in the panel header switches between the rendered view and the raw Markdown source, for the times you want to see exactly what the file says.
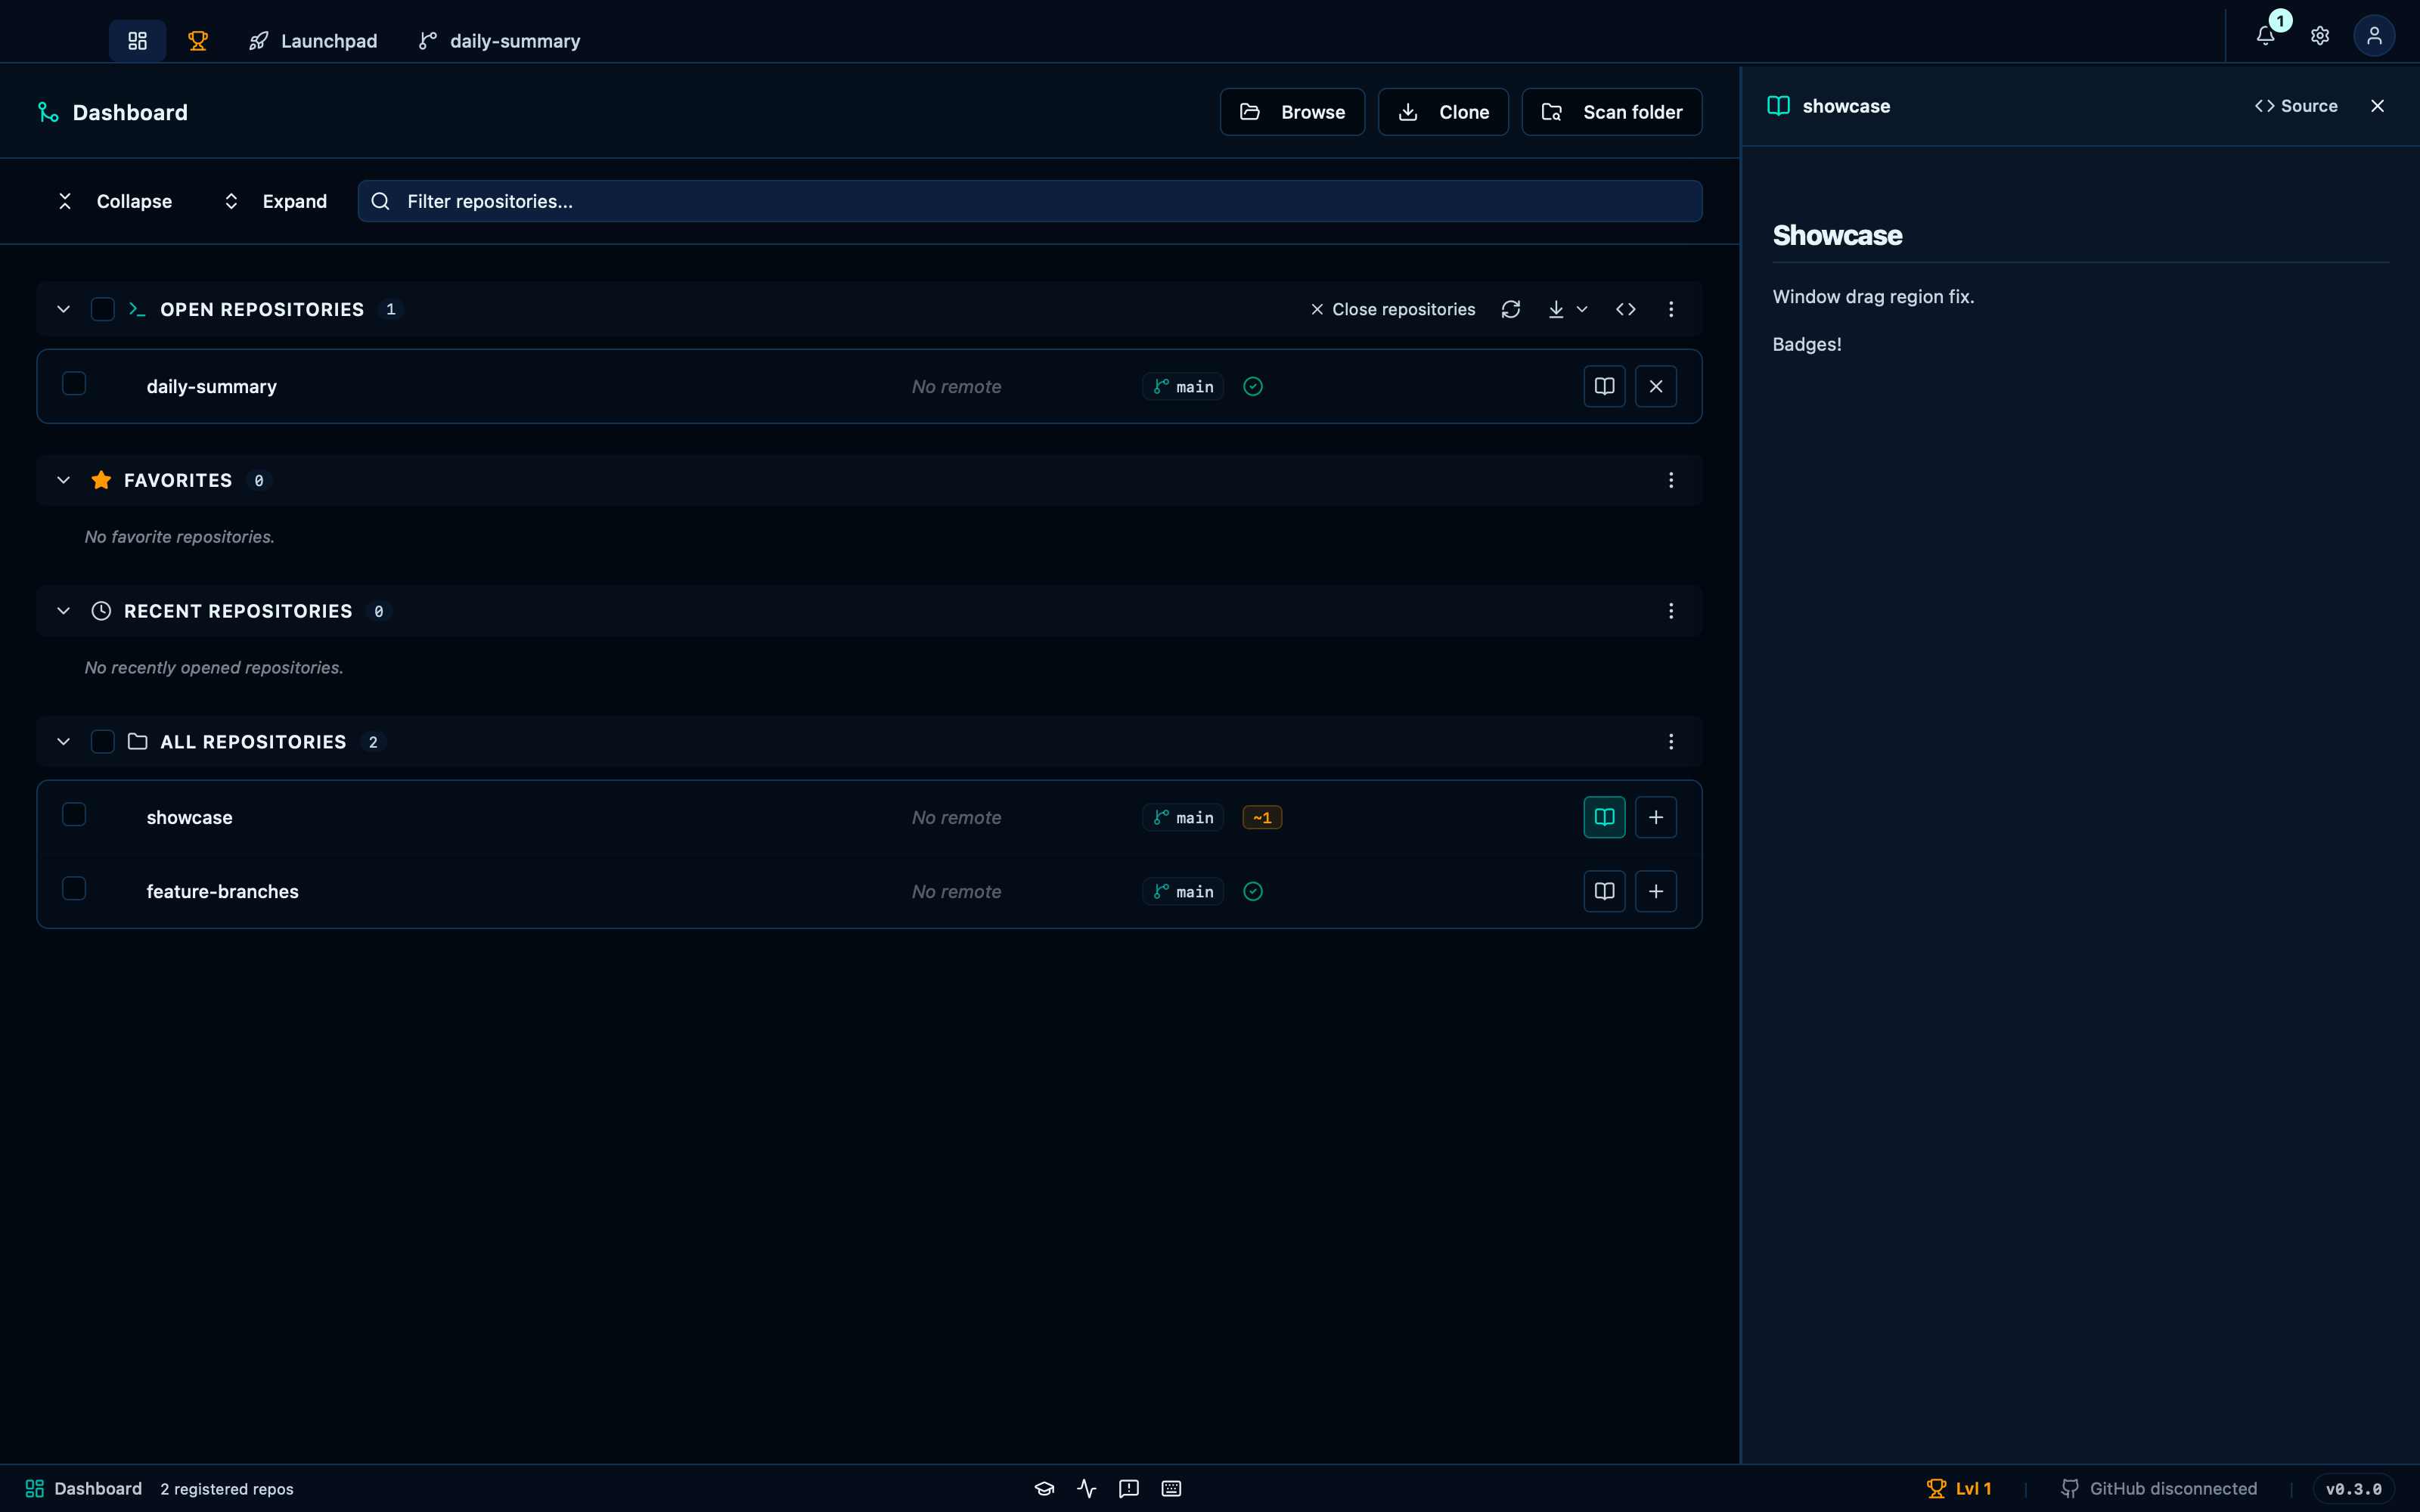
Captured from the running app by this scenario.
Do this
- Open the dashboard
- Open the
showcaseproject's README - Switch the README panel to its source view
You should see
- The README panel is shown
- The README panel shows
Showcase - The README source shows
# Showcase
Filtering, folding and hiding sections on the dashboard
Filtering by name narrows every section at once, live. Collapse and Expand fold every section's rows away or back in one click, for the times only the headers and their counts matter. Hiding a section from its own "..." menu takes it off the dashboard entirely — the button that appears next to Collapse from that moment on is the only way back, one section or all of them at once.
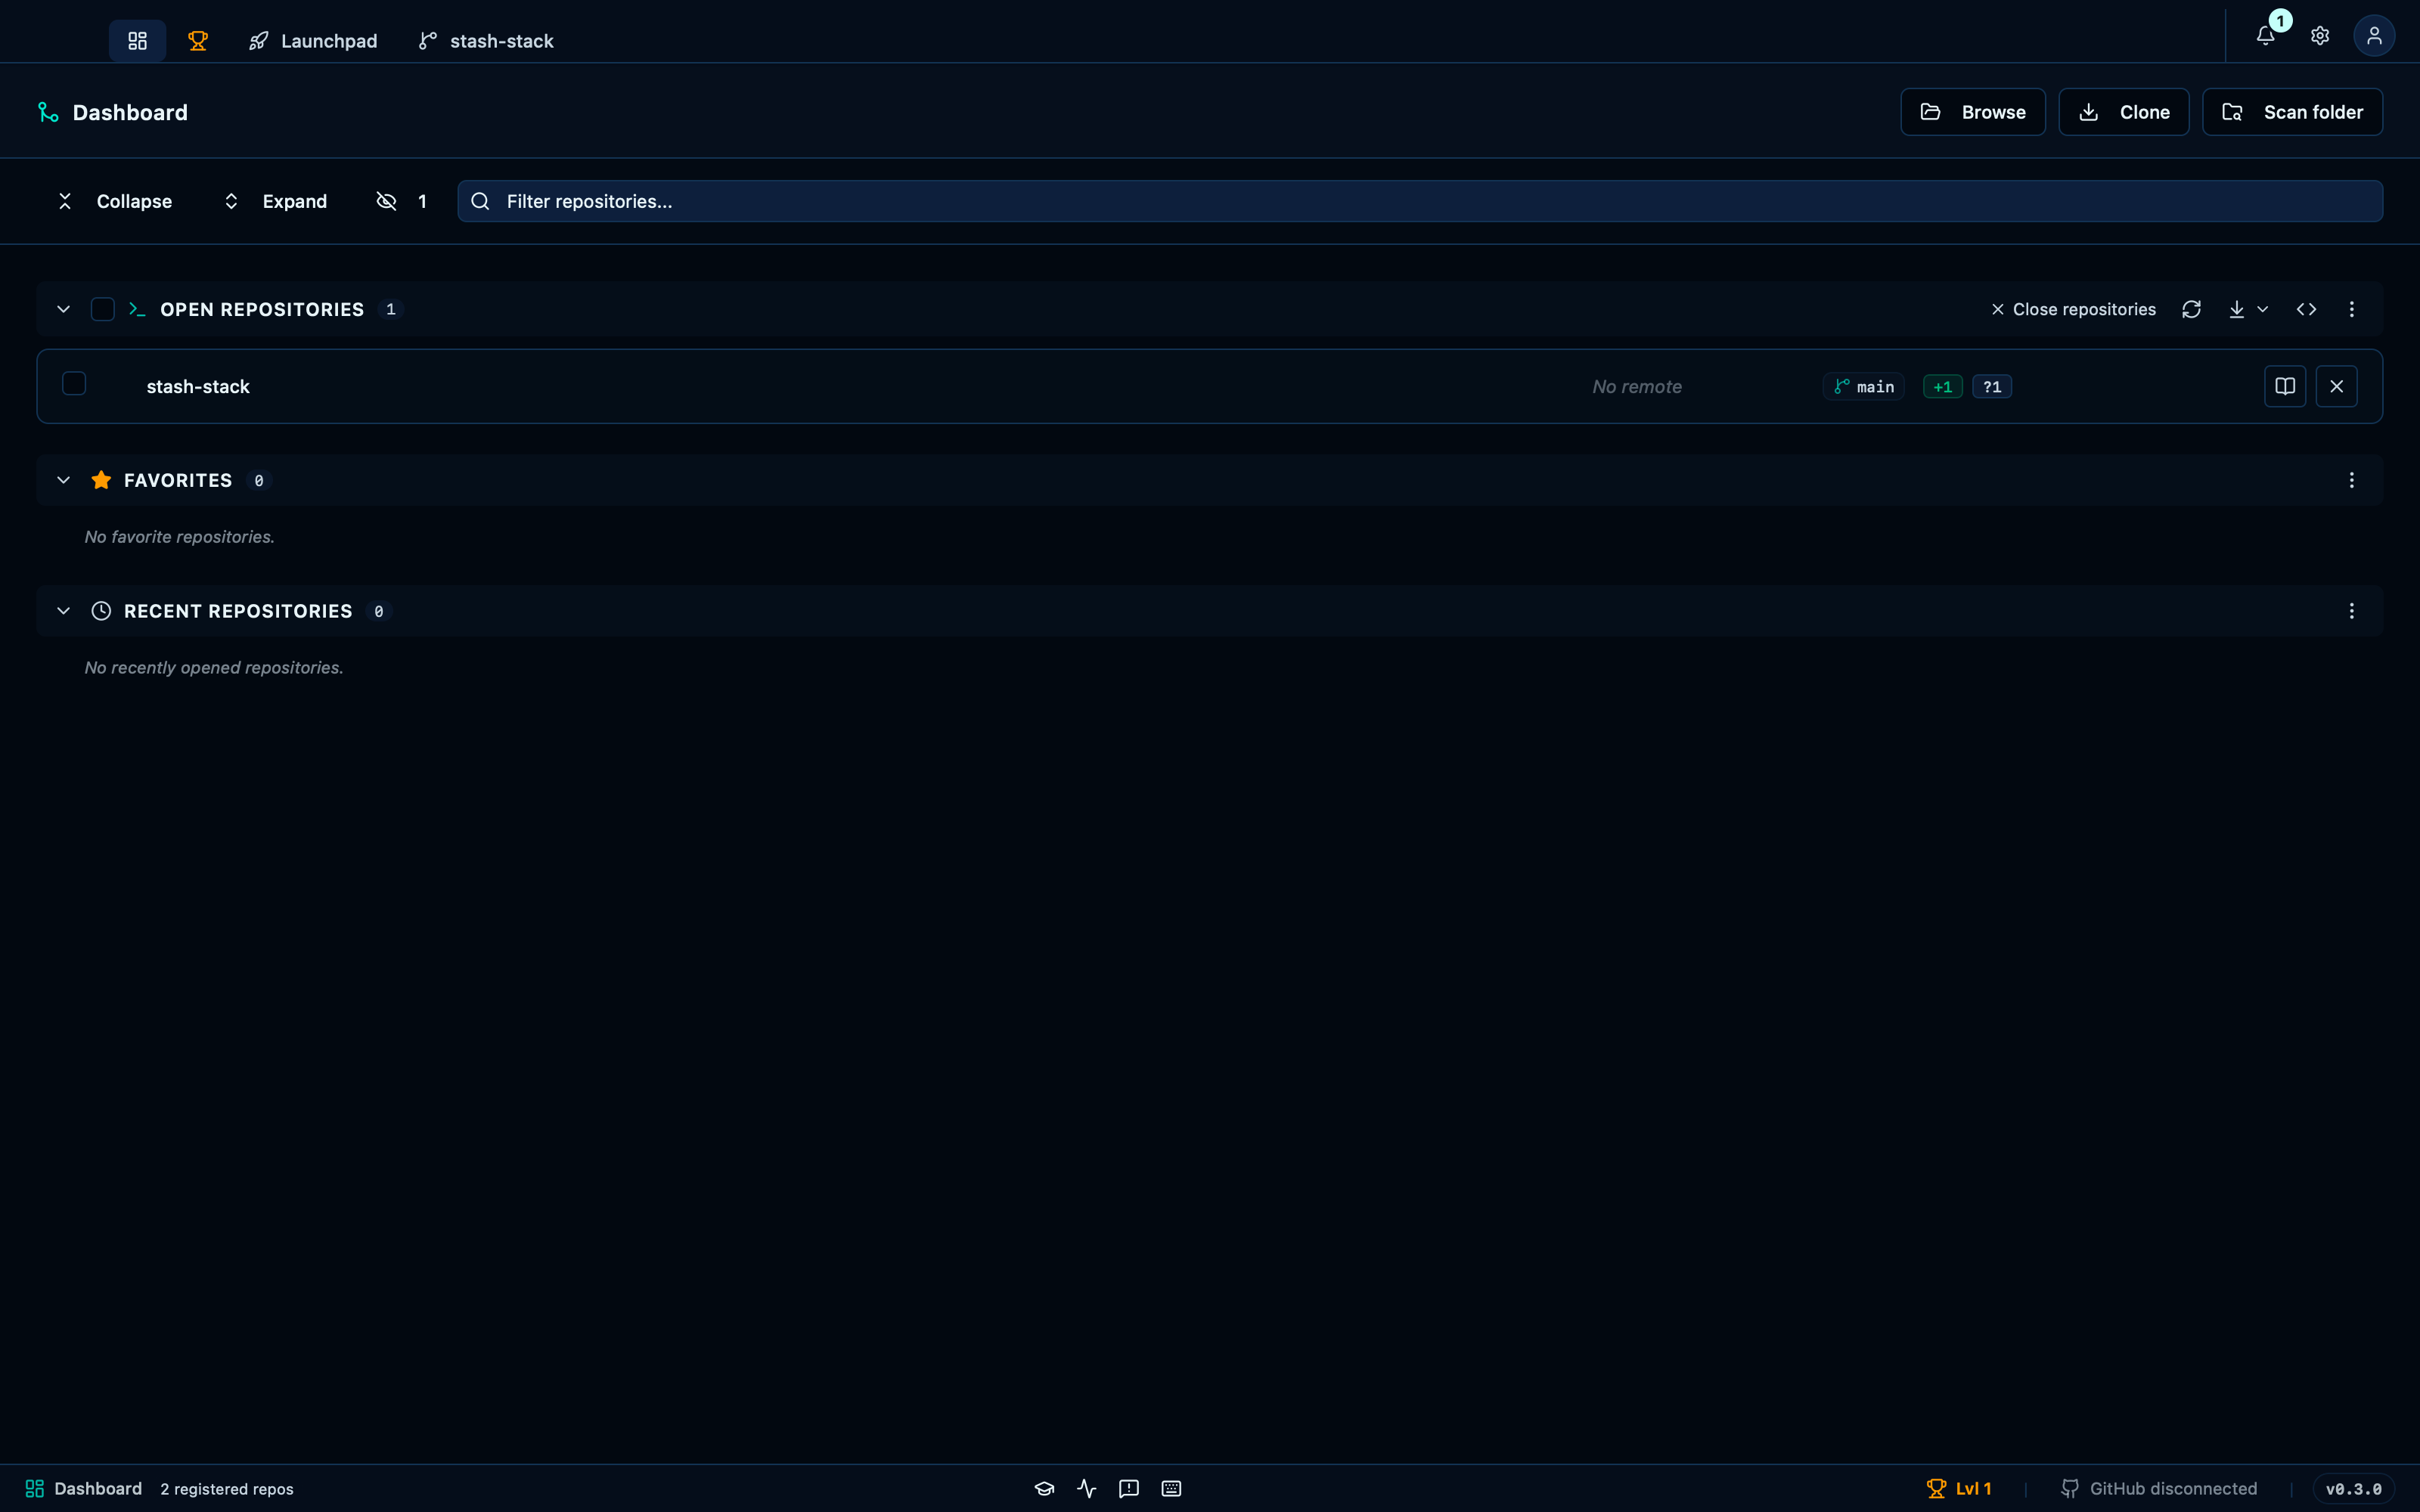
Captured from the running app by this scenario.
Do this
- Open the dashboard
- Filter the dashboard for
showcase - Clear the dashboard filter
- Collapse all dashboard sections
- Expand all dashboard sections
- Hide the
alldashboard section - Restore the
alldashboard section from the hidden sections menu
You should see
- The
showcaseproject is shown on the dashboard - The
feature-branchesproject is not shown on the dashboard - The
showcaseproject is not shown on the dashboard - The
showcaseproject is shown on the dashboard - The
alldashboard section is not shown - The
alldashboard section is shown - No error notification is displayed
Color-coding a section for a quicker scan down the dashboard
Each section's "..." menu ends in a row of colour swatches — a purely visual tag for picking a section out at a glance on a dashboard with several of them, unrelated to what it actually contains. Picking one colours the section's header immediately; the crossed-out circle clears it back to the neutral default.
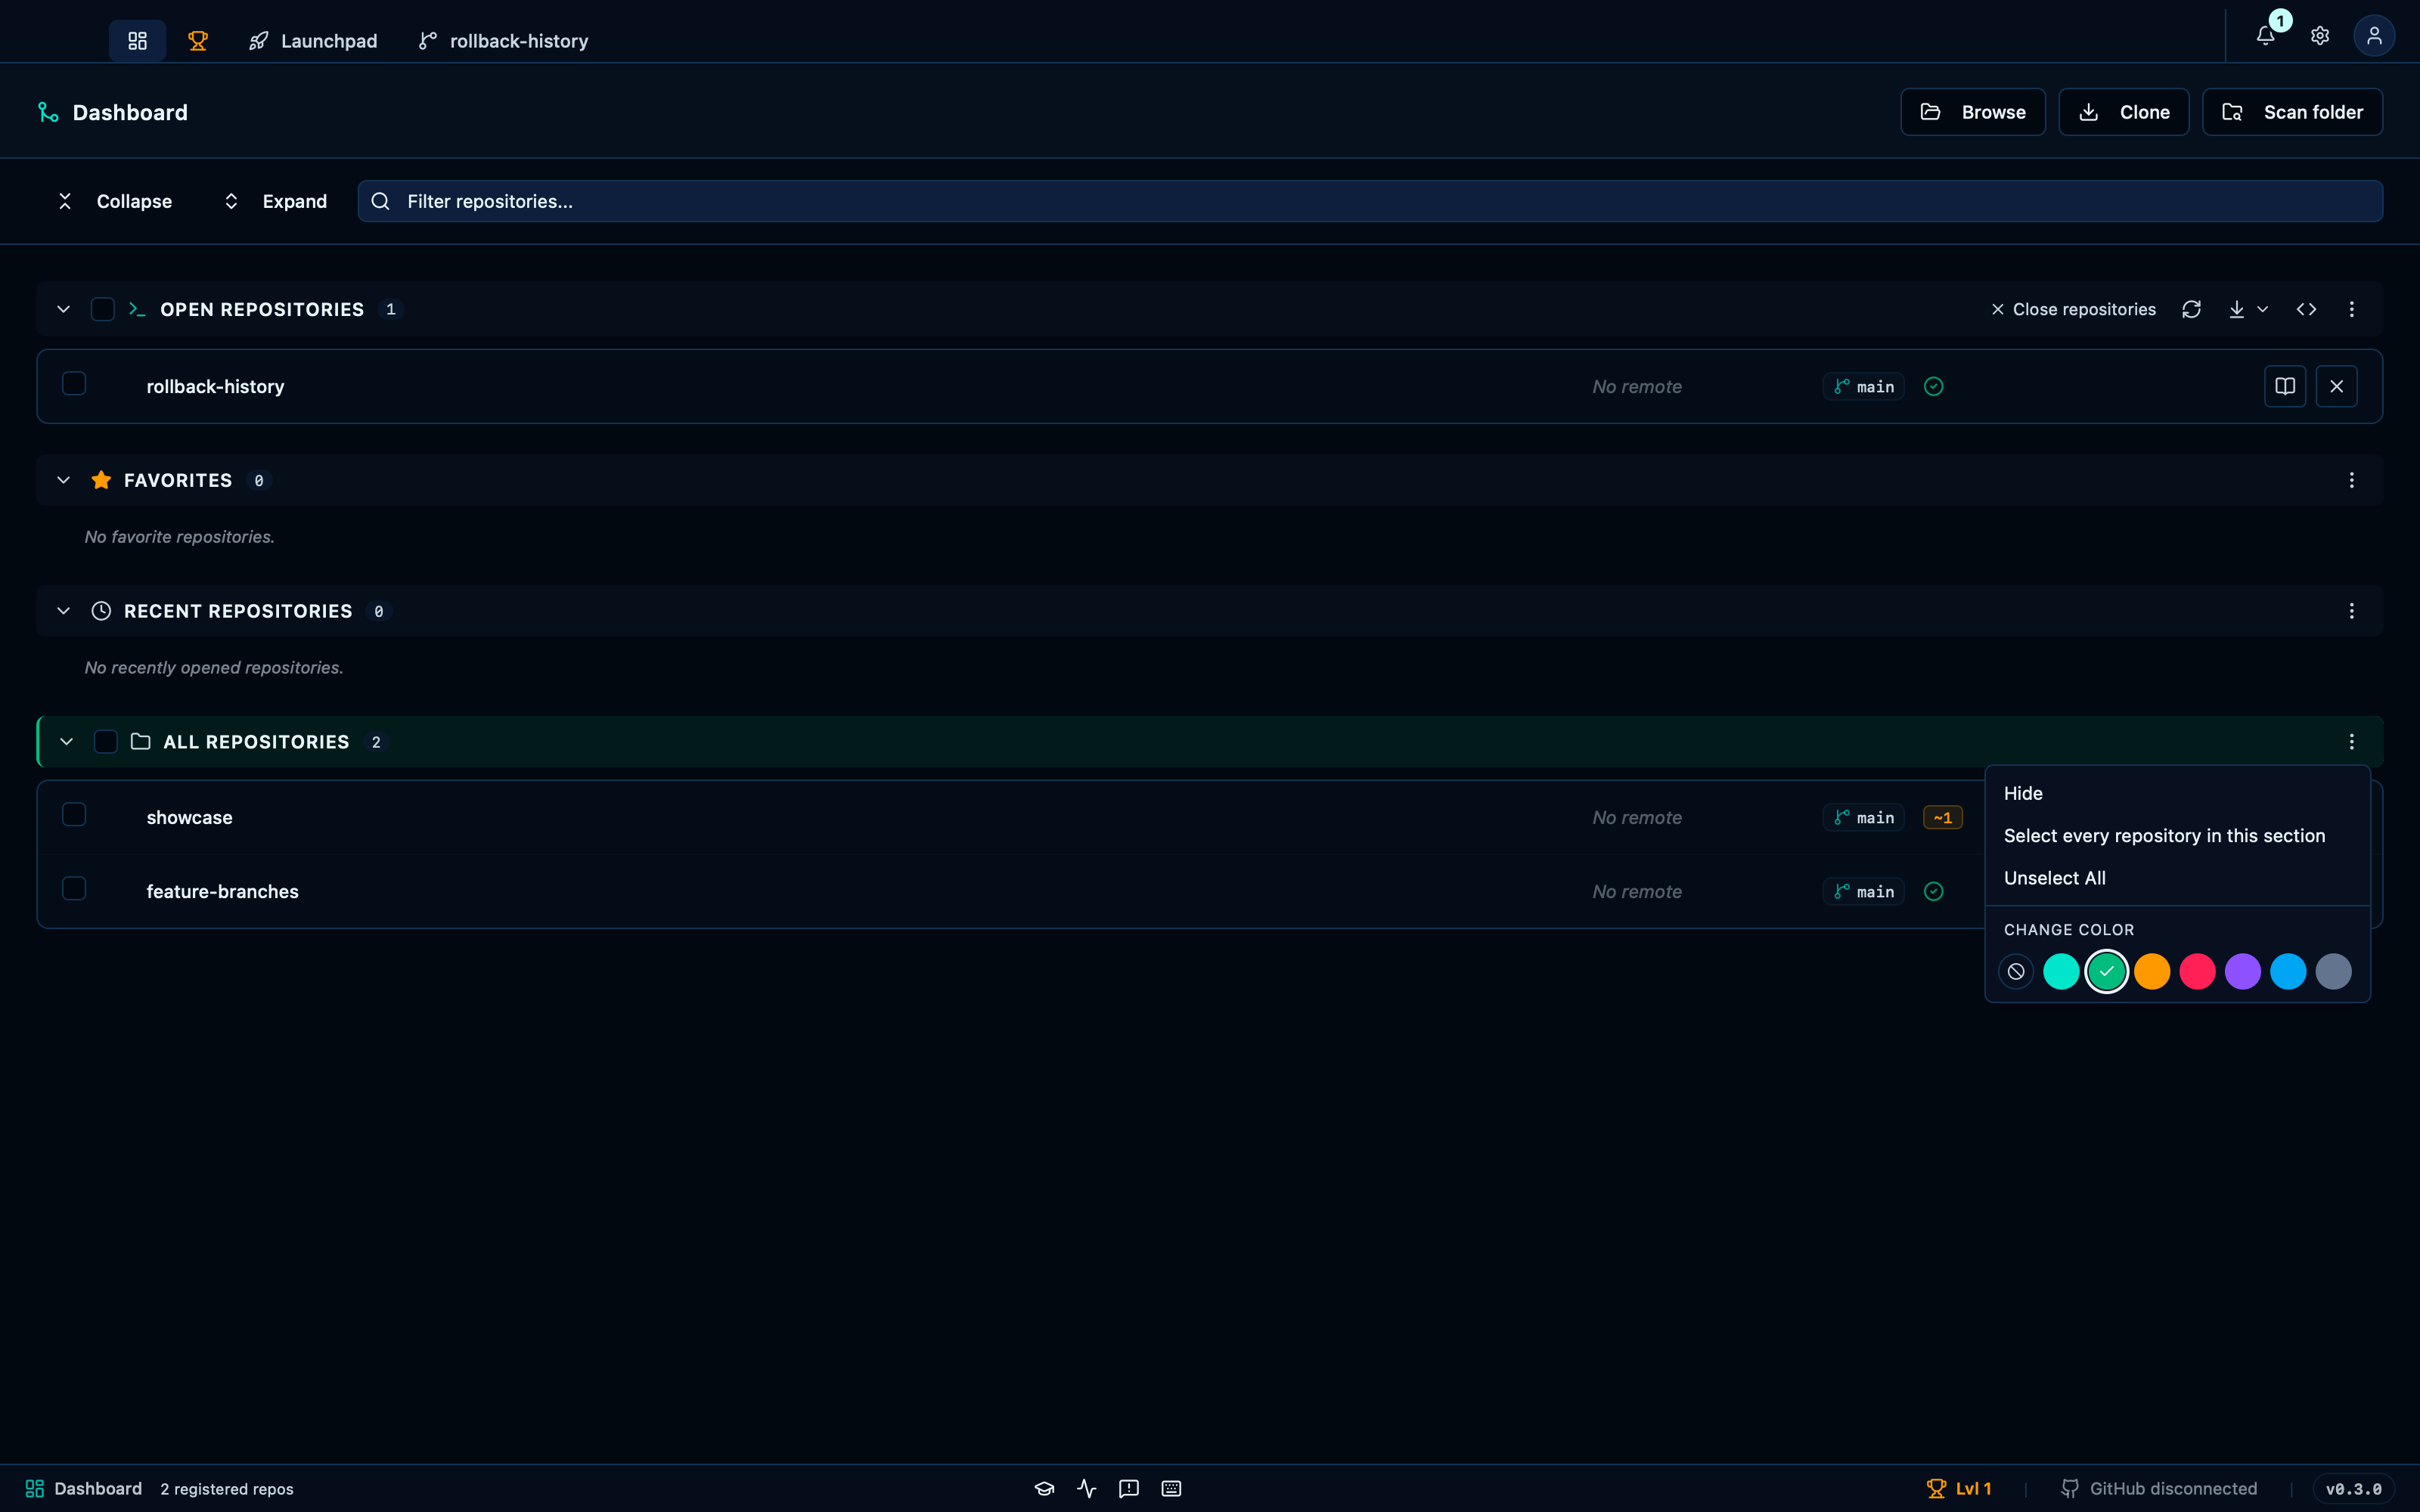
Captured from the running app by this scenario.
Do this
- Open the dashboard
- Color the
alldashboard sectionemerald - Color the
alldashboard sectionnone
You should see
- The
alldashboard section is coloredemerald - The
alldashboard section is not colored
Each row reports its branch and what is waiting in it
Every row carries the state of its repository without opening it: the branch it is on, and counters for what is staged, changed but unstaged, untracked or conflicted — so a glance down the list says which projects have work left in them. A repository with nothing pending collapses to a single check mark, keeping a tidy list quiet.
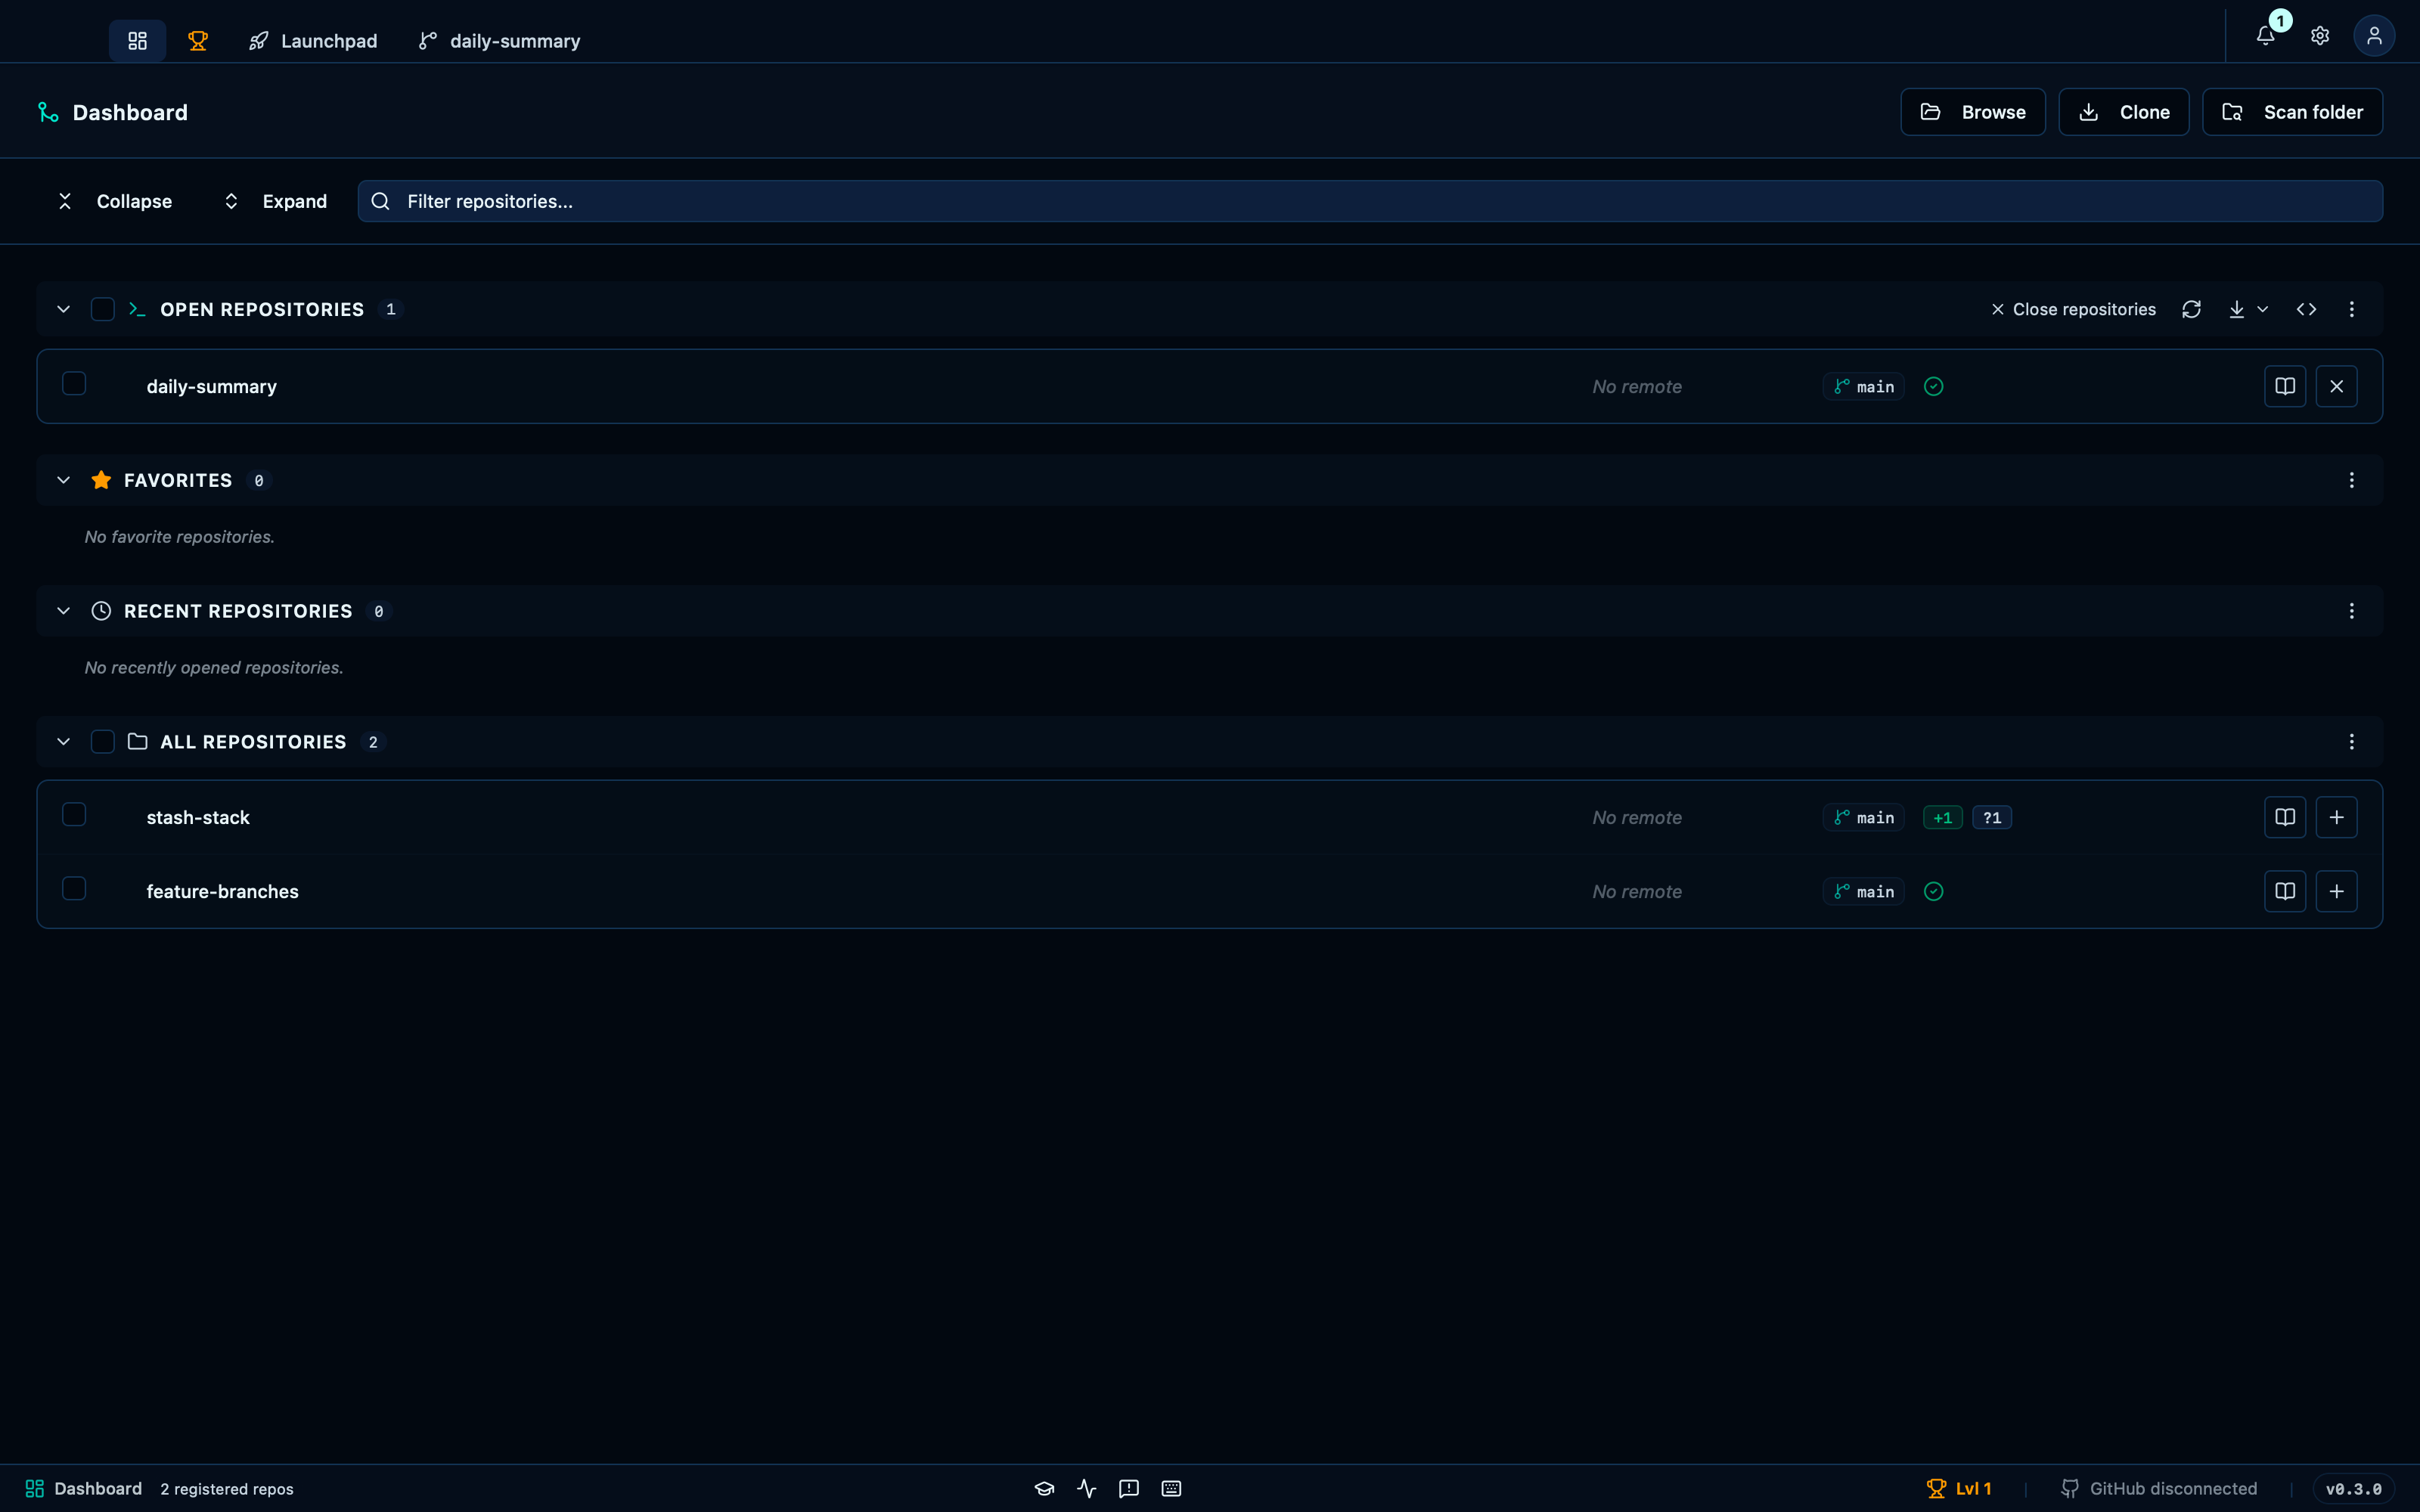
Captured from the running app by this scenario.
Do this
- Open the dashboard
You should see
- The
stash-stackrow is on branchmain - The
stash-stackrow reports 1 staged and 1 untracked change - The
feature-branchesrow reports a clean working tree
Fetching or pulling several repositories at once from a section
Checking a row's box turns every action in the section's header into a bulk one — the "N selected" count next to them is what says so, and every other row still targets the whole section when nothing is checked. Fetch and Pull work the same way here as they do on the toolbar of an open repository, just run over every checked repository in turn: one unreachable remote never stops the others.
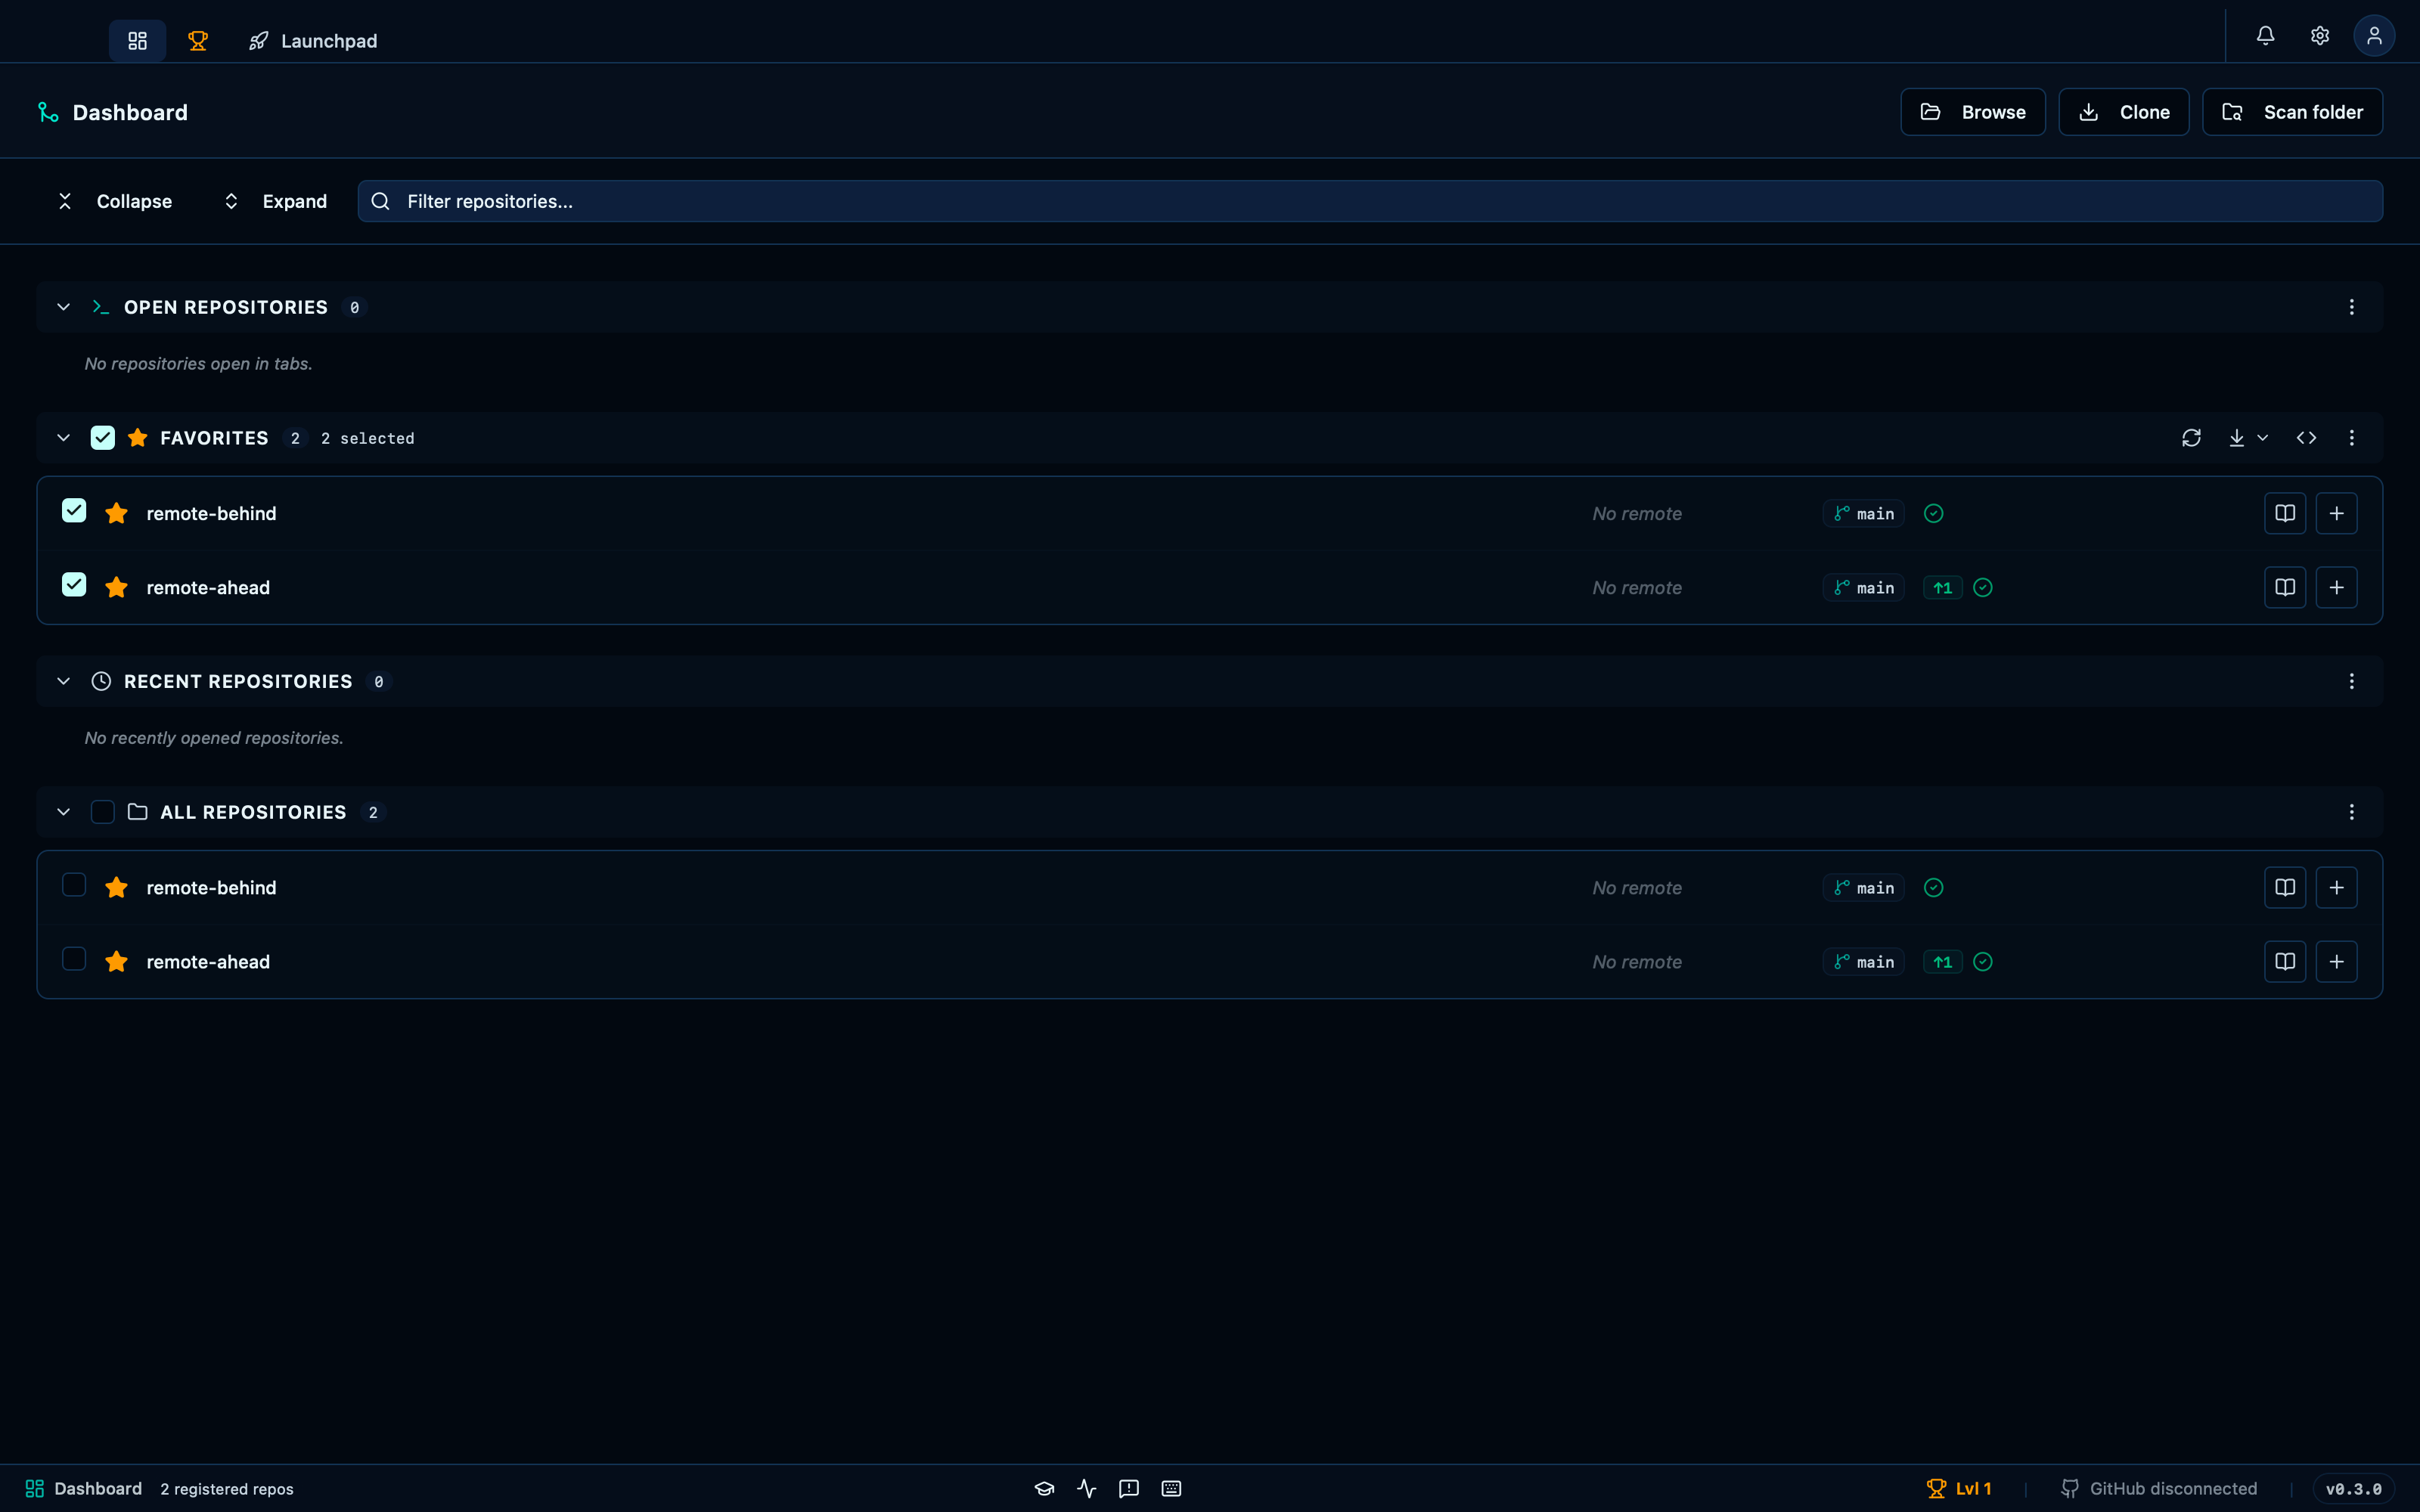
Captured from the running app by this scenario.
Do this
- Open the dashboard
- Select the
remote-behindandremote-aheadprojects on the dashboard - Pull the favorites section with the
fast-forward-if-possiblestrategy
You should see
- The favorites section reports 2 selected
- The
remote-behindproject's HEAD commit subject containsteammate's follow-up commit - No error notification is displayed
Scanning a folder discovers the repositories inside it
"Scan folder" is the other way onto the dashboard besides opening or cloning one repository at a time: pick a parent folder and every repository it contains — up to 4 levels deep — is added at once, exactly as if each had been opened individually.
Do this
- Open the dashboard
- Click the scan-repos button
- Choose
/tmp/git-manager-fixturesin the folder picker
You should see
- The
stash-stackproject is shown on the dashboard - The
feature-branchesproject is shown on the dashboard
The dashboard before any repository has been opened
Before you've opened or scanned for a single repository, the dashboard is one screen rather than four empty sections — a short explanation and the same "Open repository" action the toolbar itself offers, with nothing to search, collapse or filter yet.
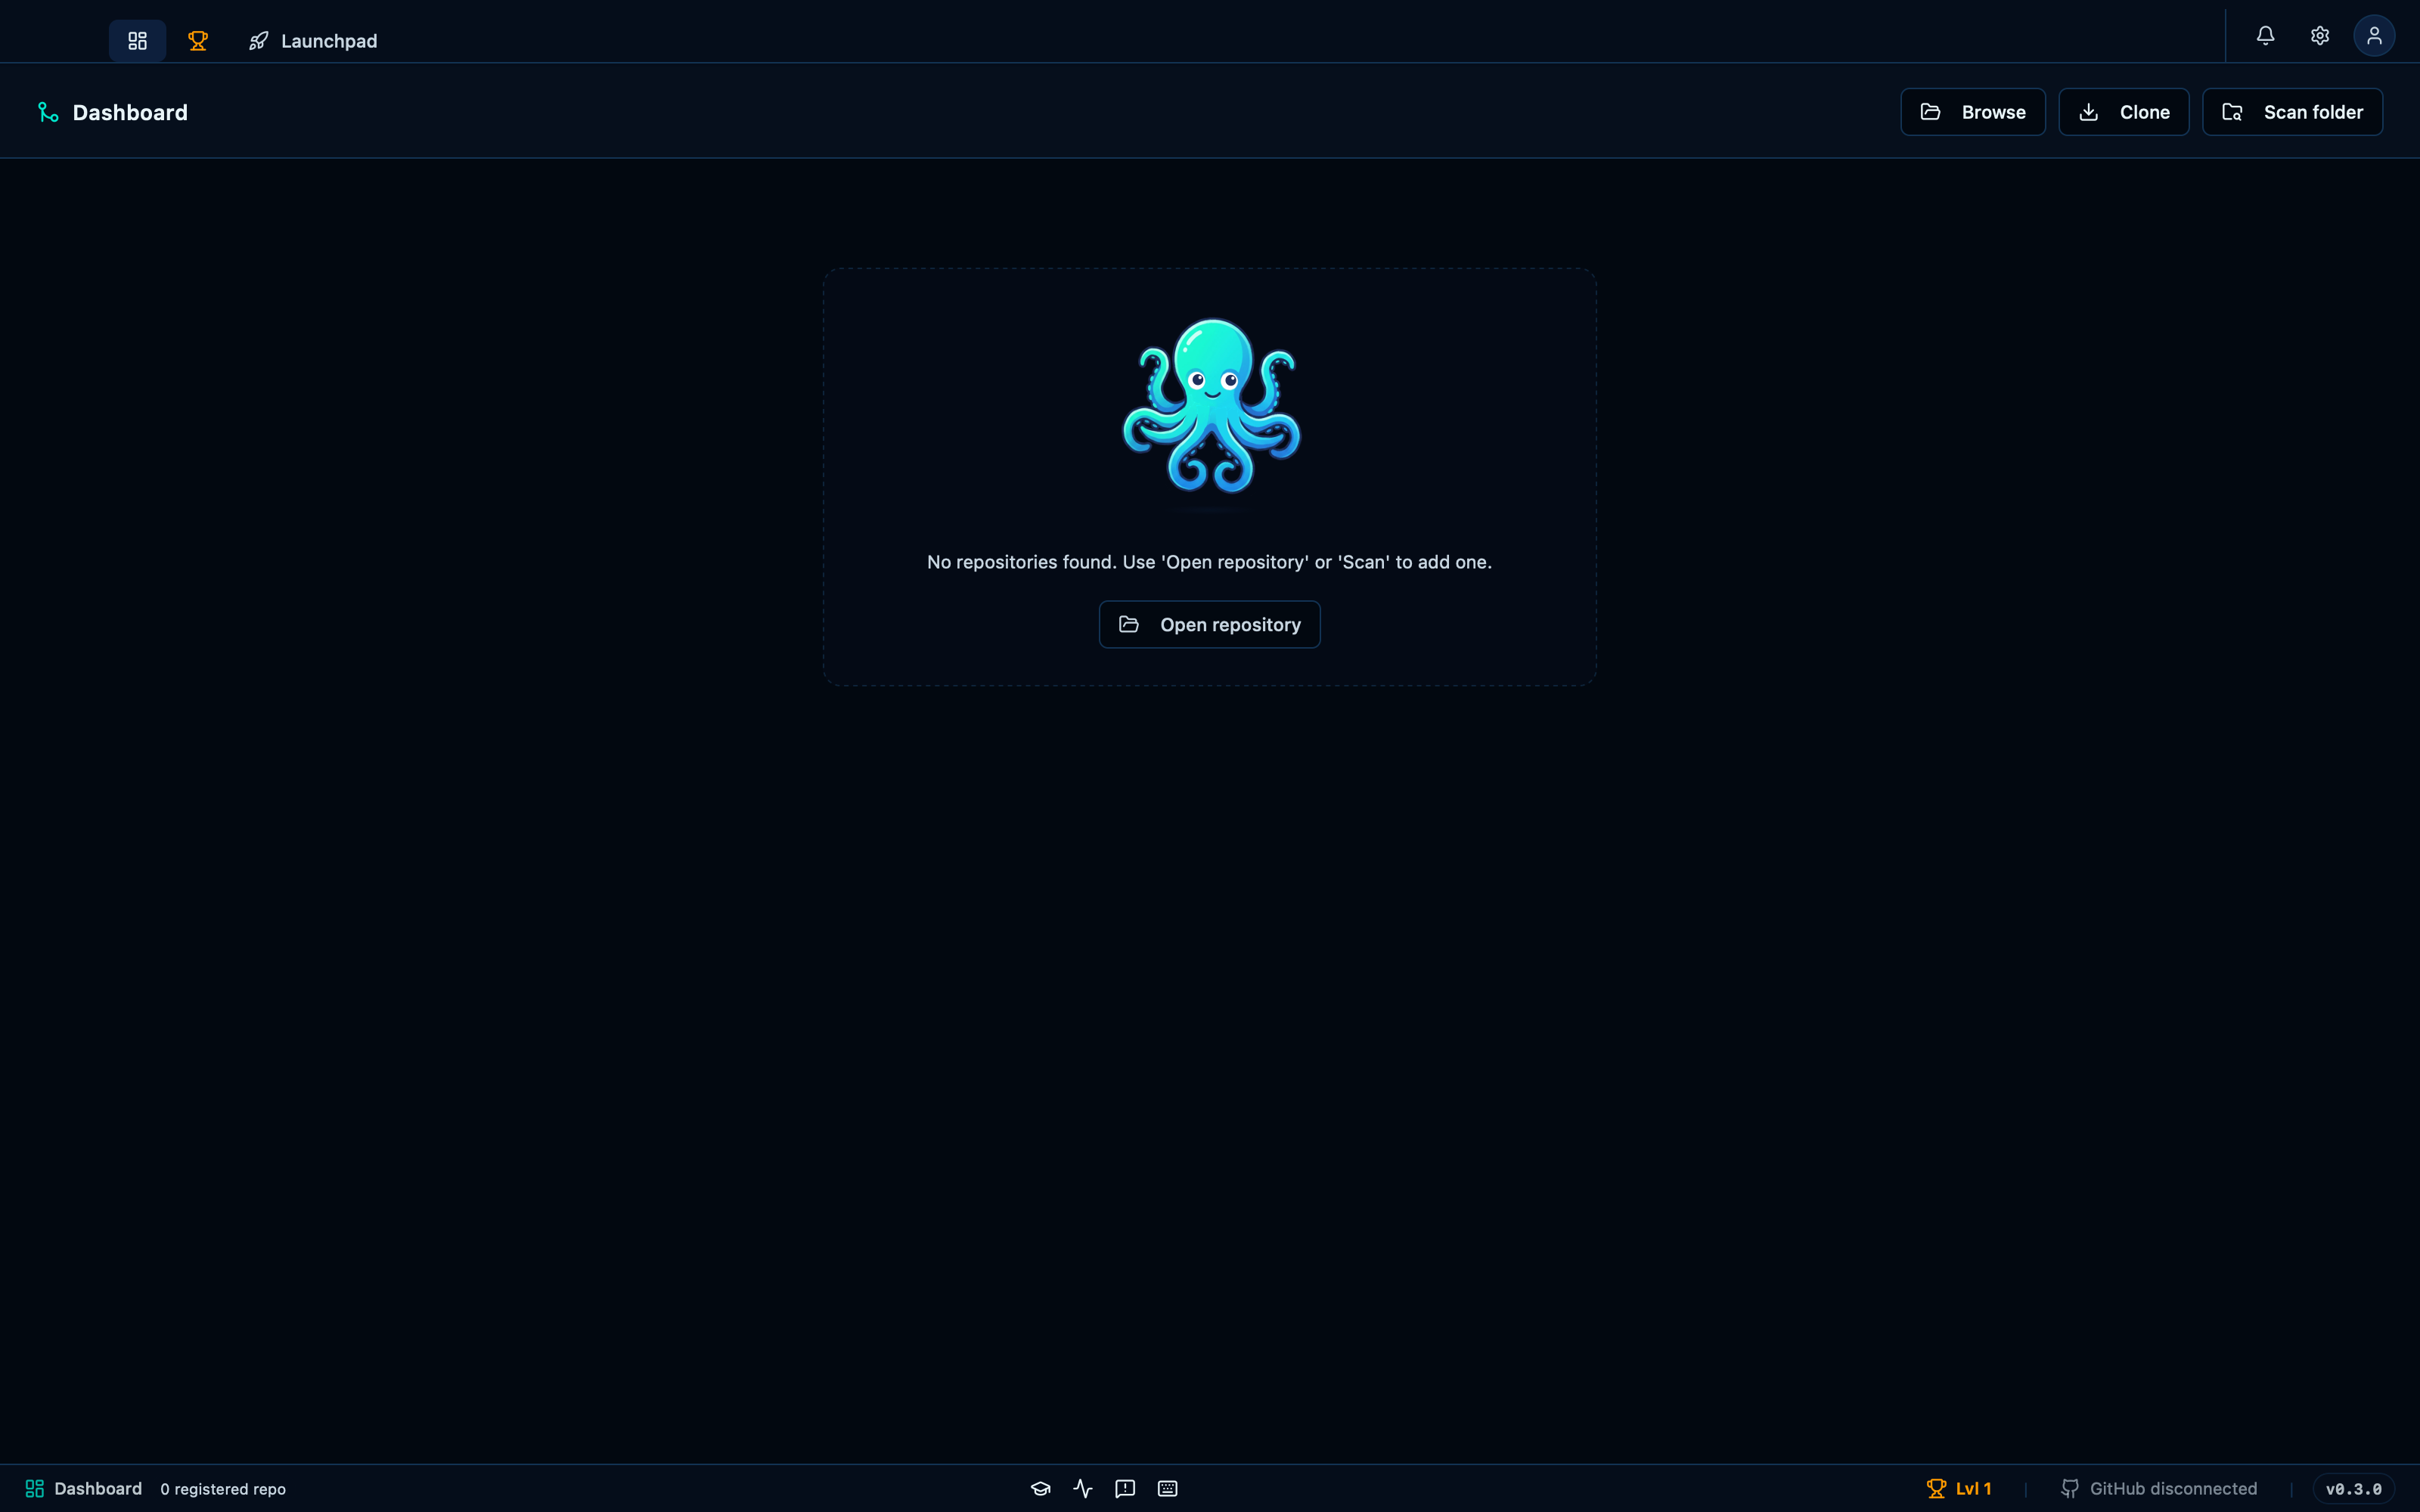
Captured from the running app by this scenario.
Do this
- Open the dashboard
You should see
- The dashboard shows its empty state
This page is generated from apps/e2e/features/dashboard.feature, the end-to-end test that drives the feature it describes.