
The Activity log
The Activity Logs takeover (reached from the footer) captures every backend call the app makes — git2 operations and shell-outs alike — as a flat, filterable stream. Capture is always on; there is no separate opt-in. It's the debugging counterpart to the Action Journal (AI features section): the journal reframes the same underlying log for a reader who wants to learn what an action did, this view is the raw trace for whoever is chasing why something broke.
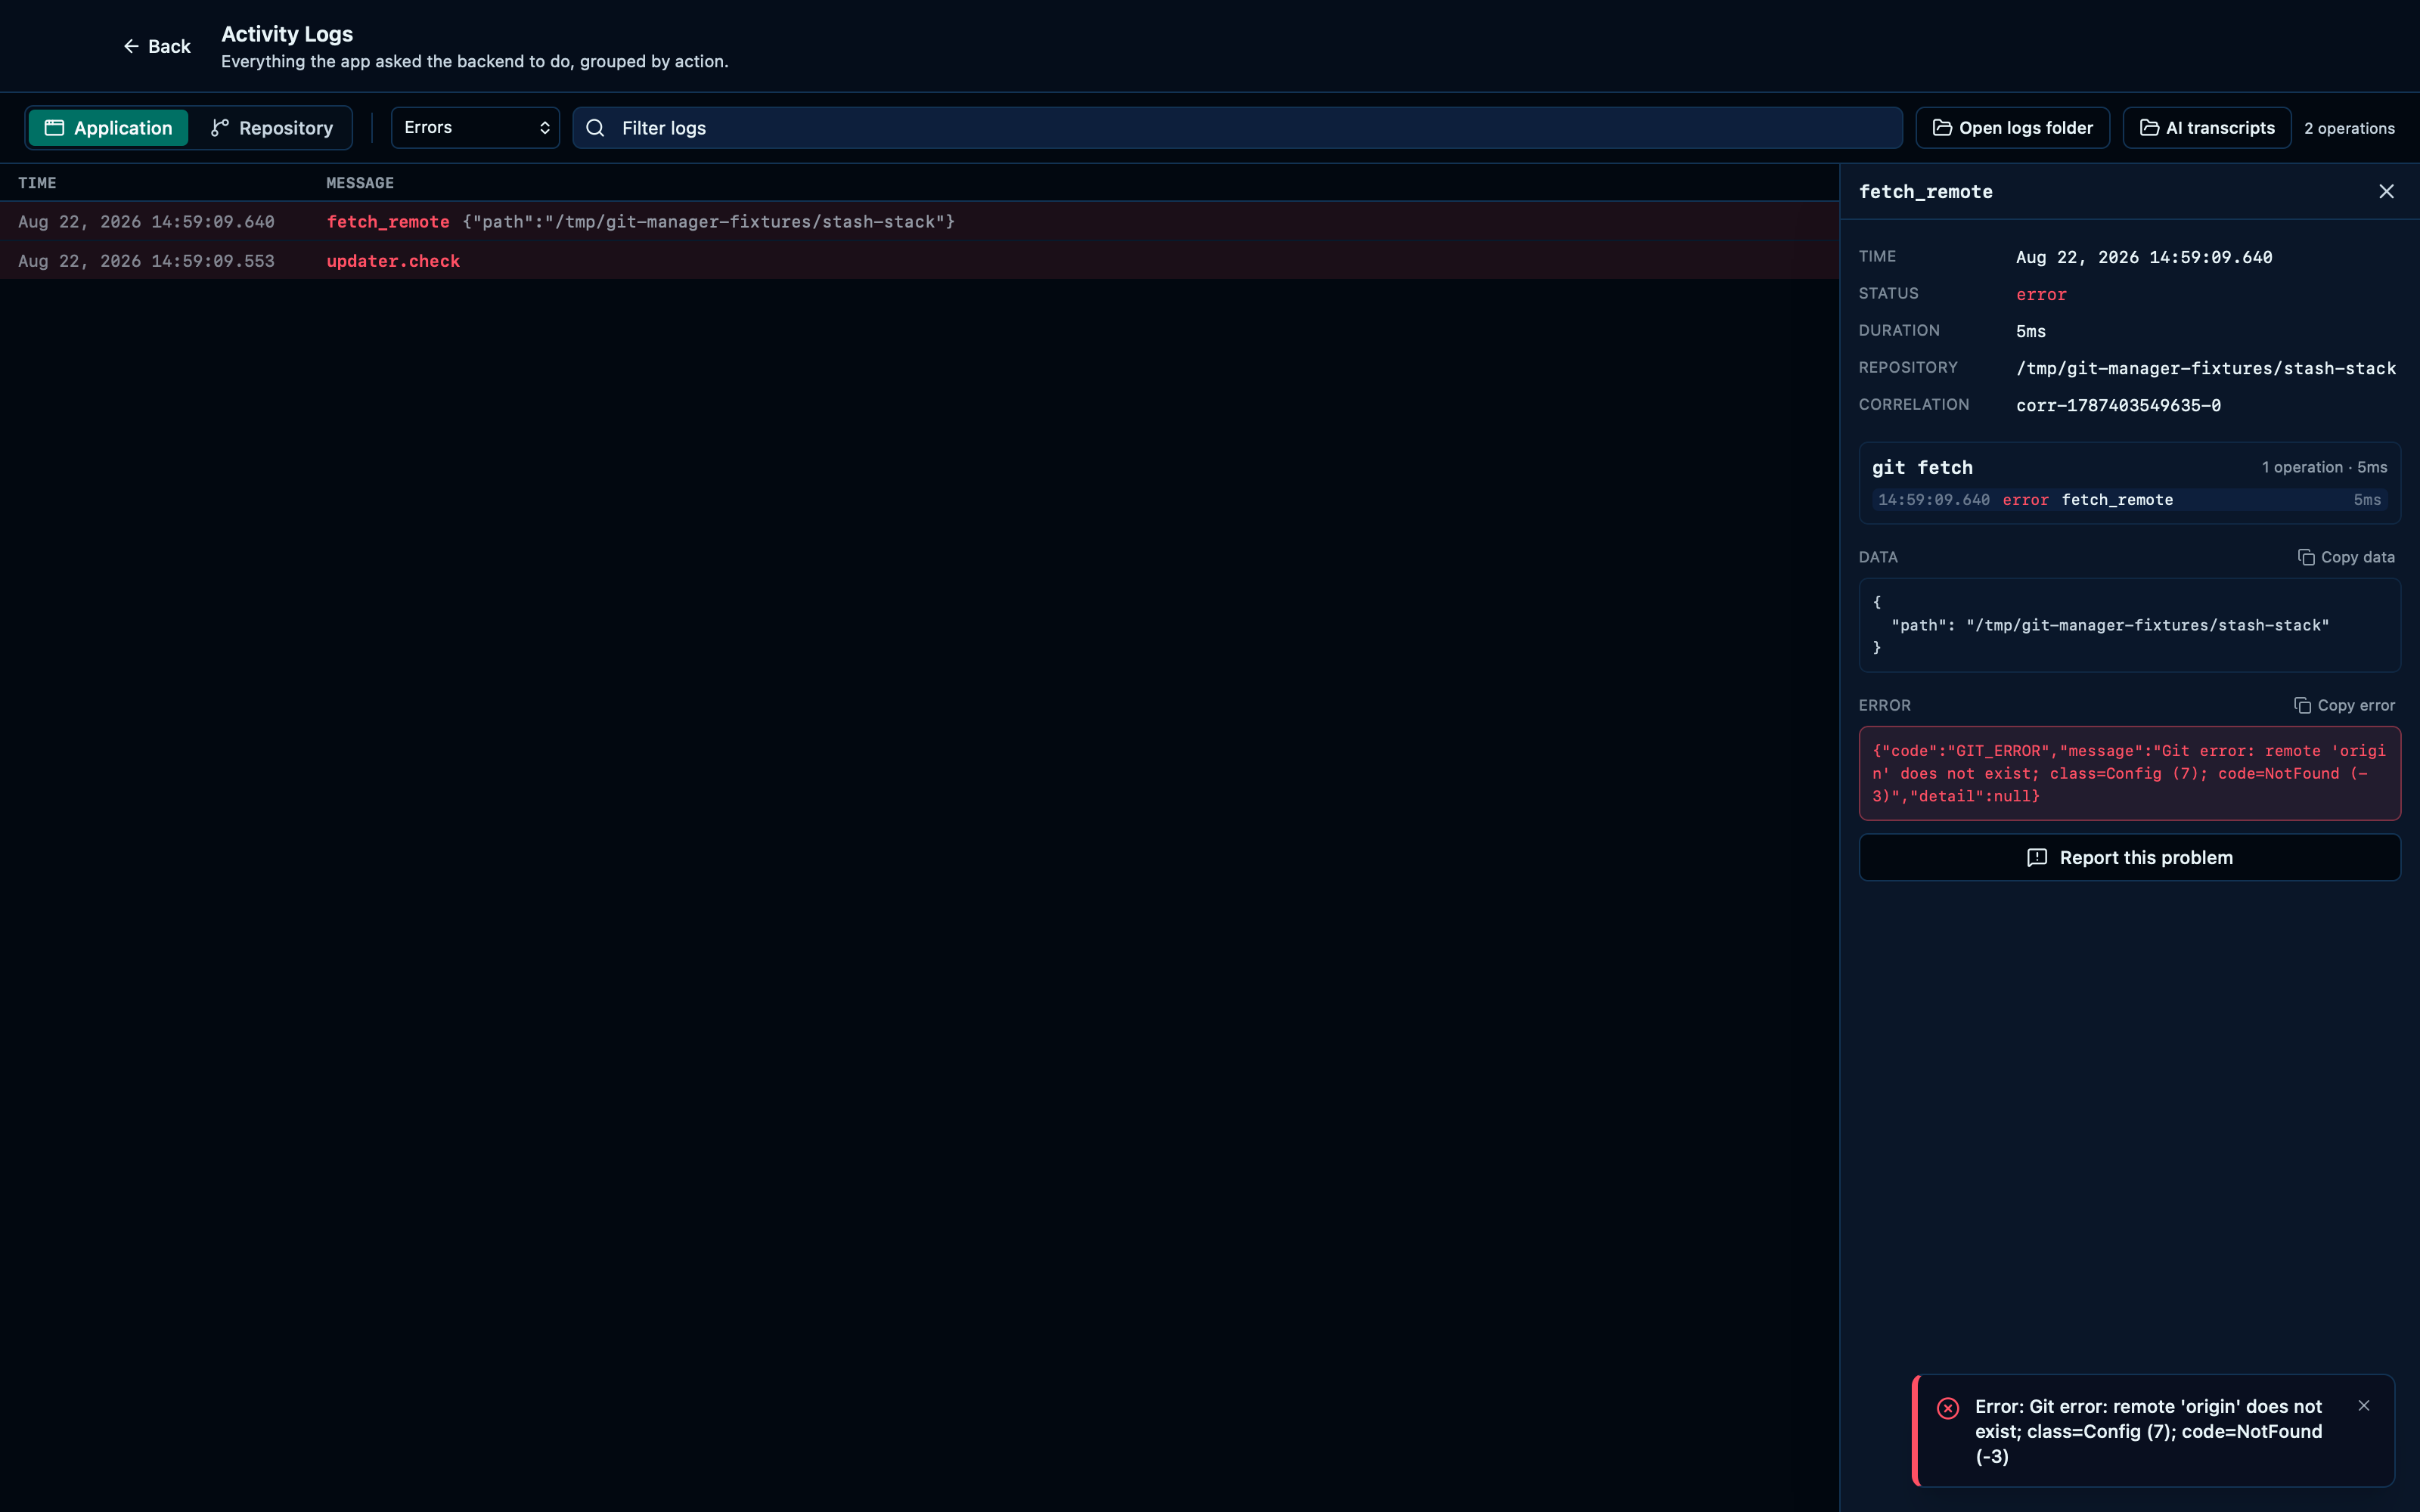
Filtering the activity log to errors only
Every call is captured whether it succeeds or fails, so switching the level filter to Errors narrows a long stream down to just the operations that actually went wrong.
Captured from the running app by this scenario.
Do this
- Click the toolbar fetch button
- Open the activity logs
- Filter the activity log to errors only
- Open the
fetch_remoteactivity log entry
You should see
- The activity log does not show a
get_repo_statusentry - The activity log detail shows the error for
fetch_remote
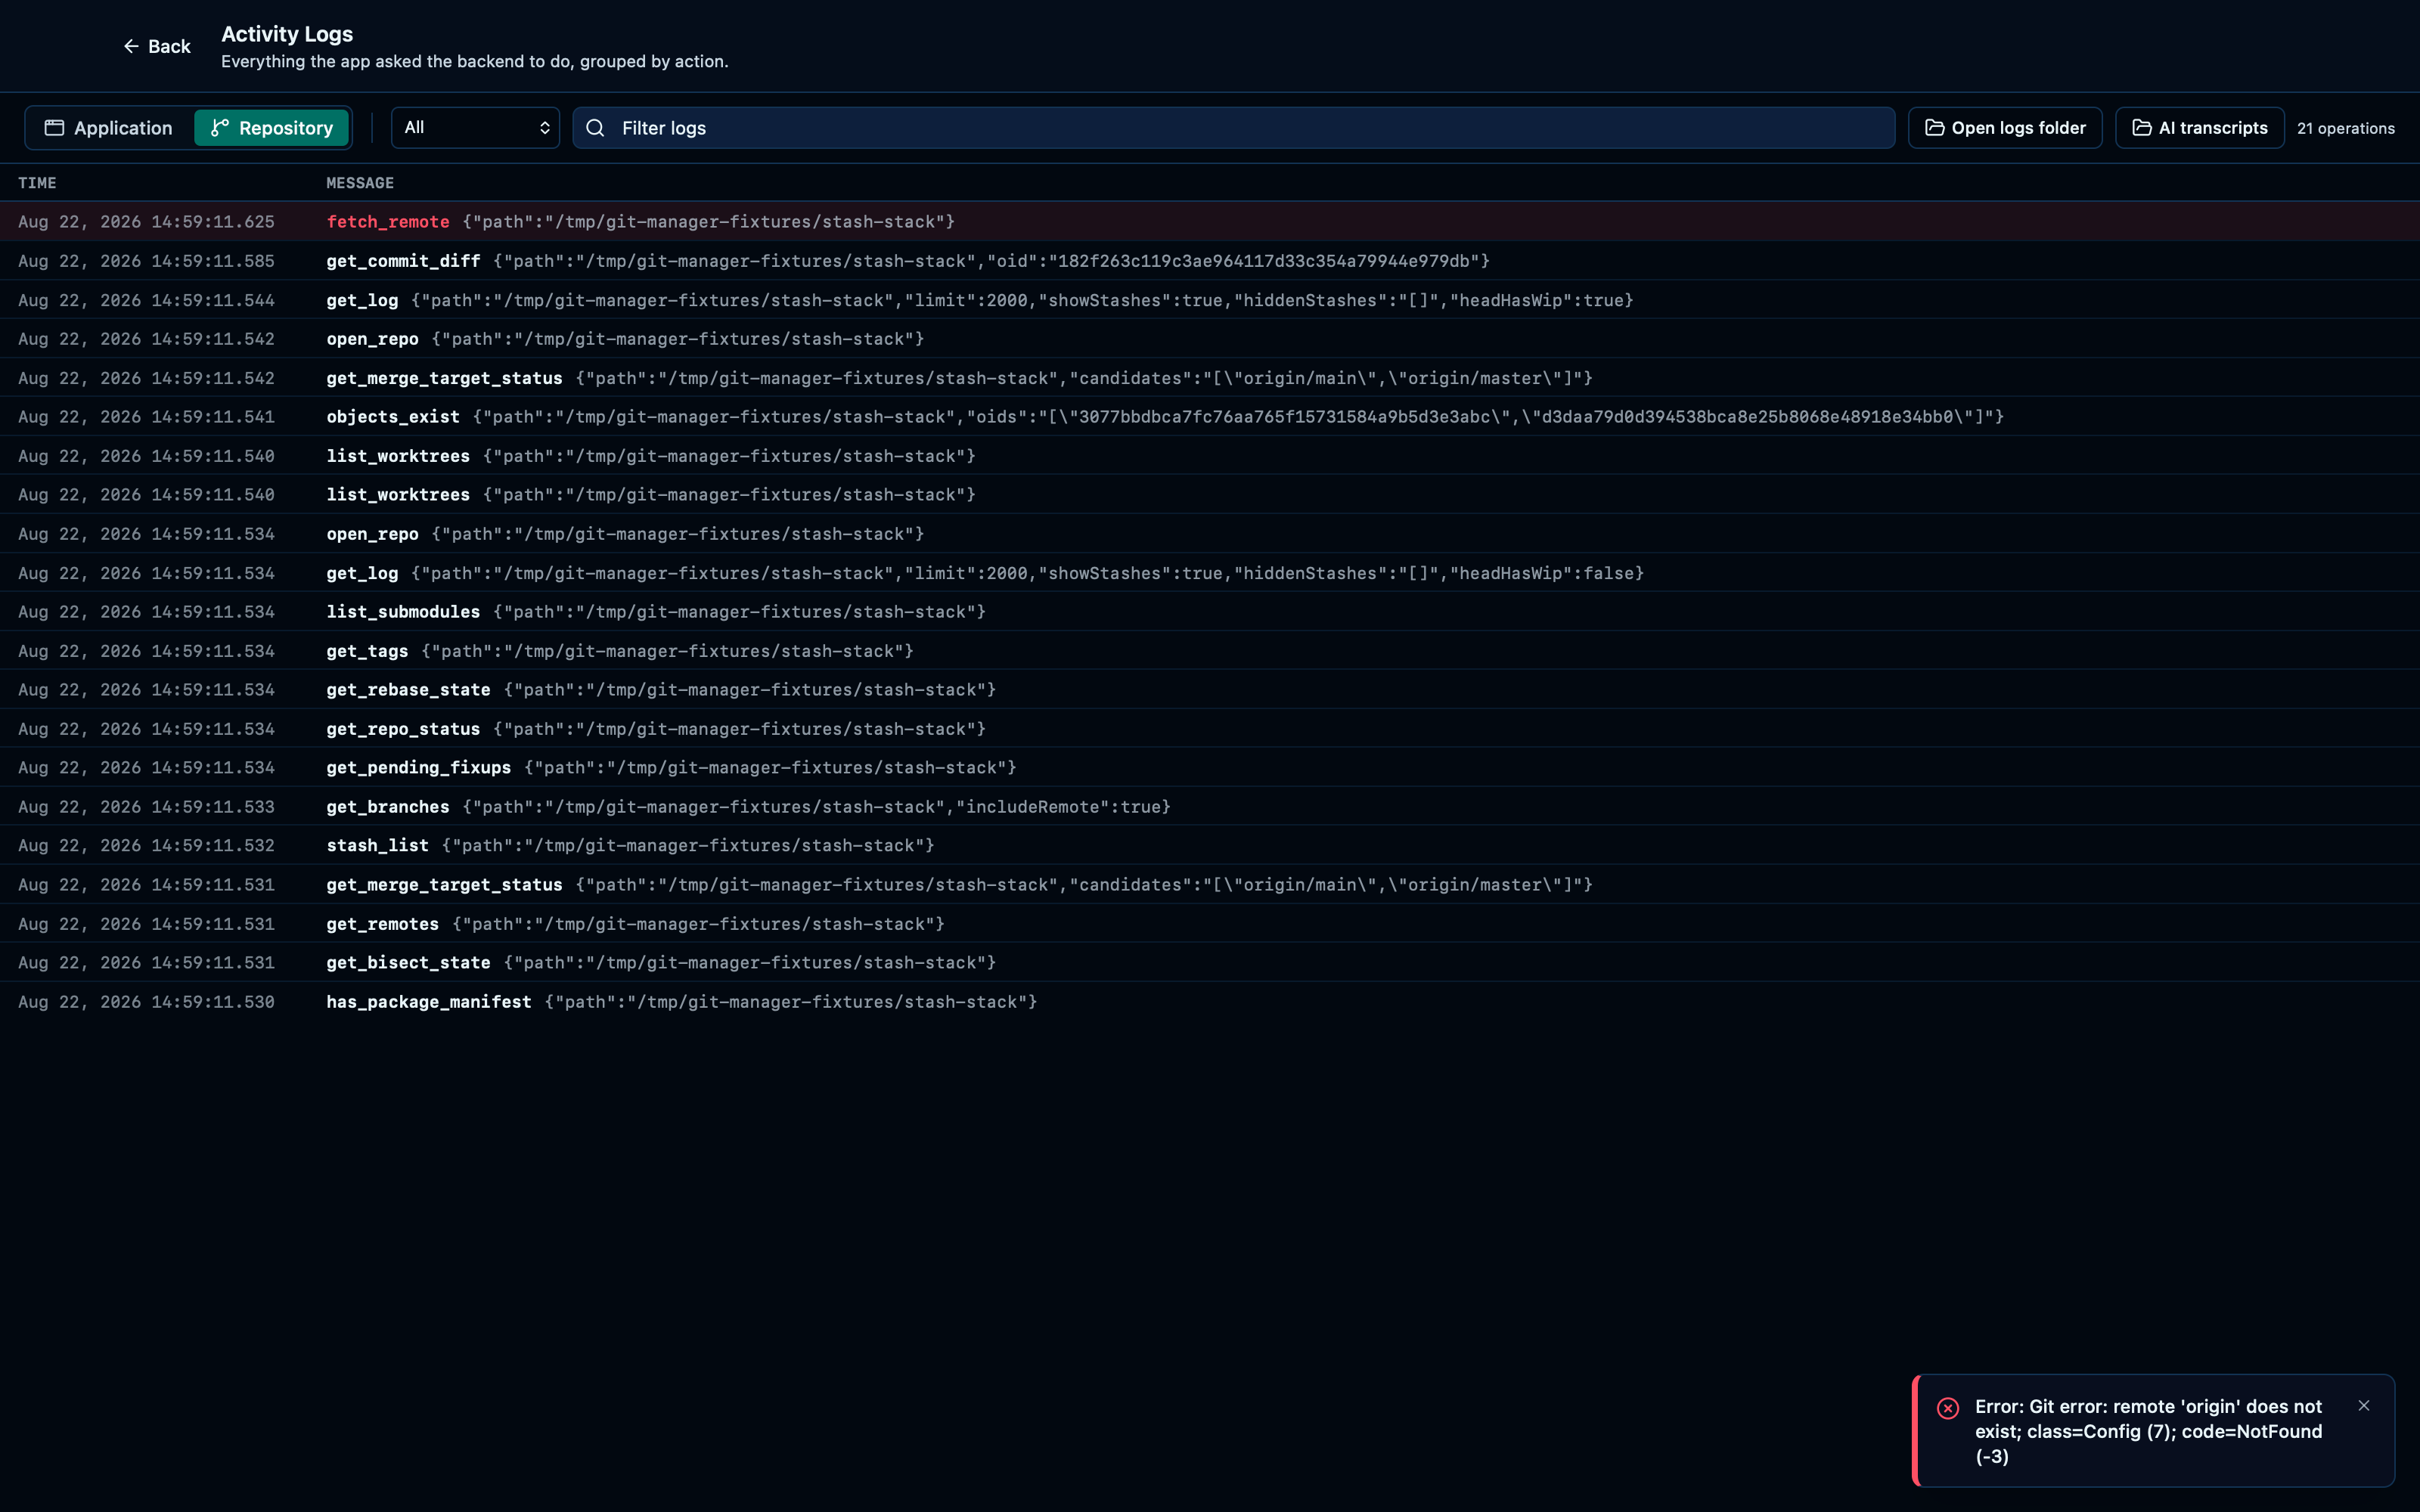
Narrowing the activity log to the active repository
"Application" is the default: every operation the app has run, across every repository you've touched. Switching to "Repository" narrows the same stream down to just the one that's currently open — useful once the Application view has piled up work from repositories you aren't looking at anymore.
Captured from the running app by this scenario.
Do this
- Click the toolbar fetch button
- Open the activity logs
- Switch the activity log scope to
repository
You should see
- The activity log scope is
application - The activity log shows a
fetch_remoteentry - The activity log scope is
repository - The activity log shows a
fetch_remoteentry
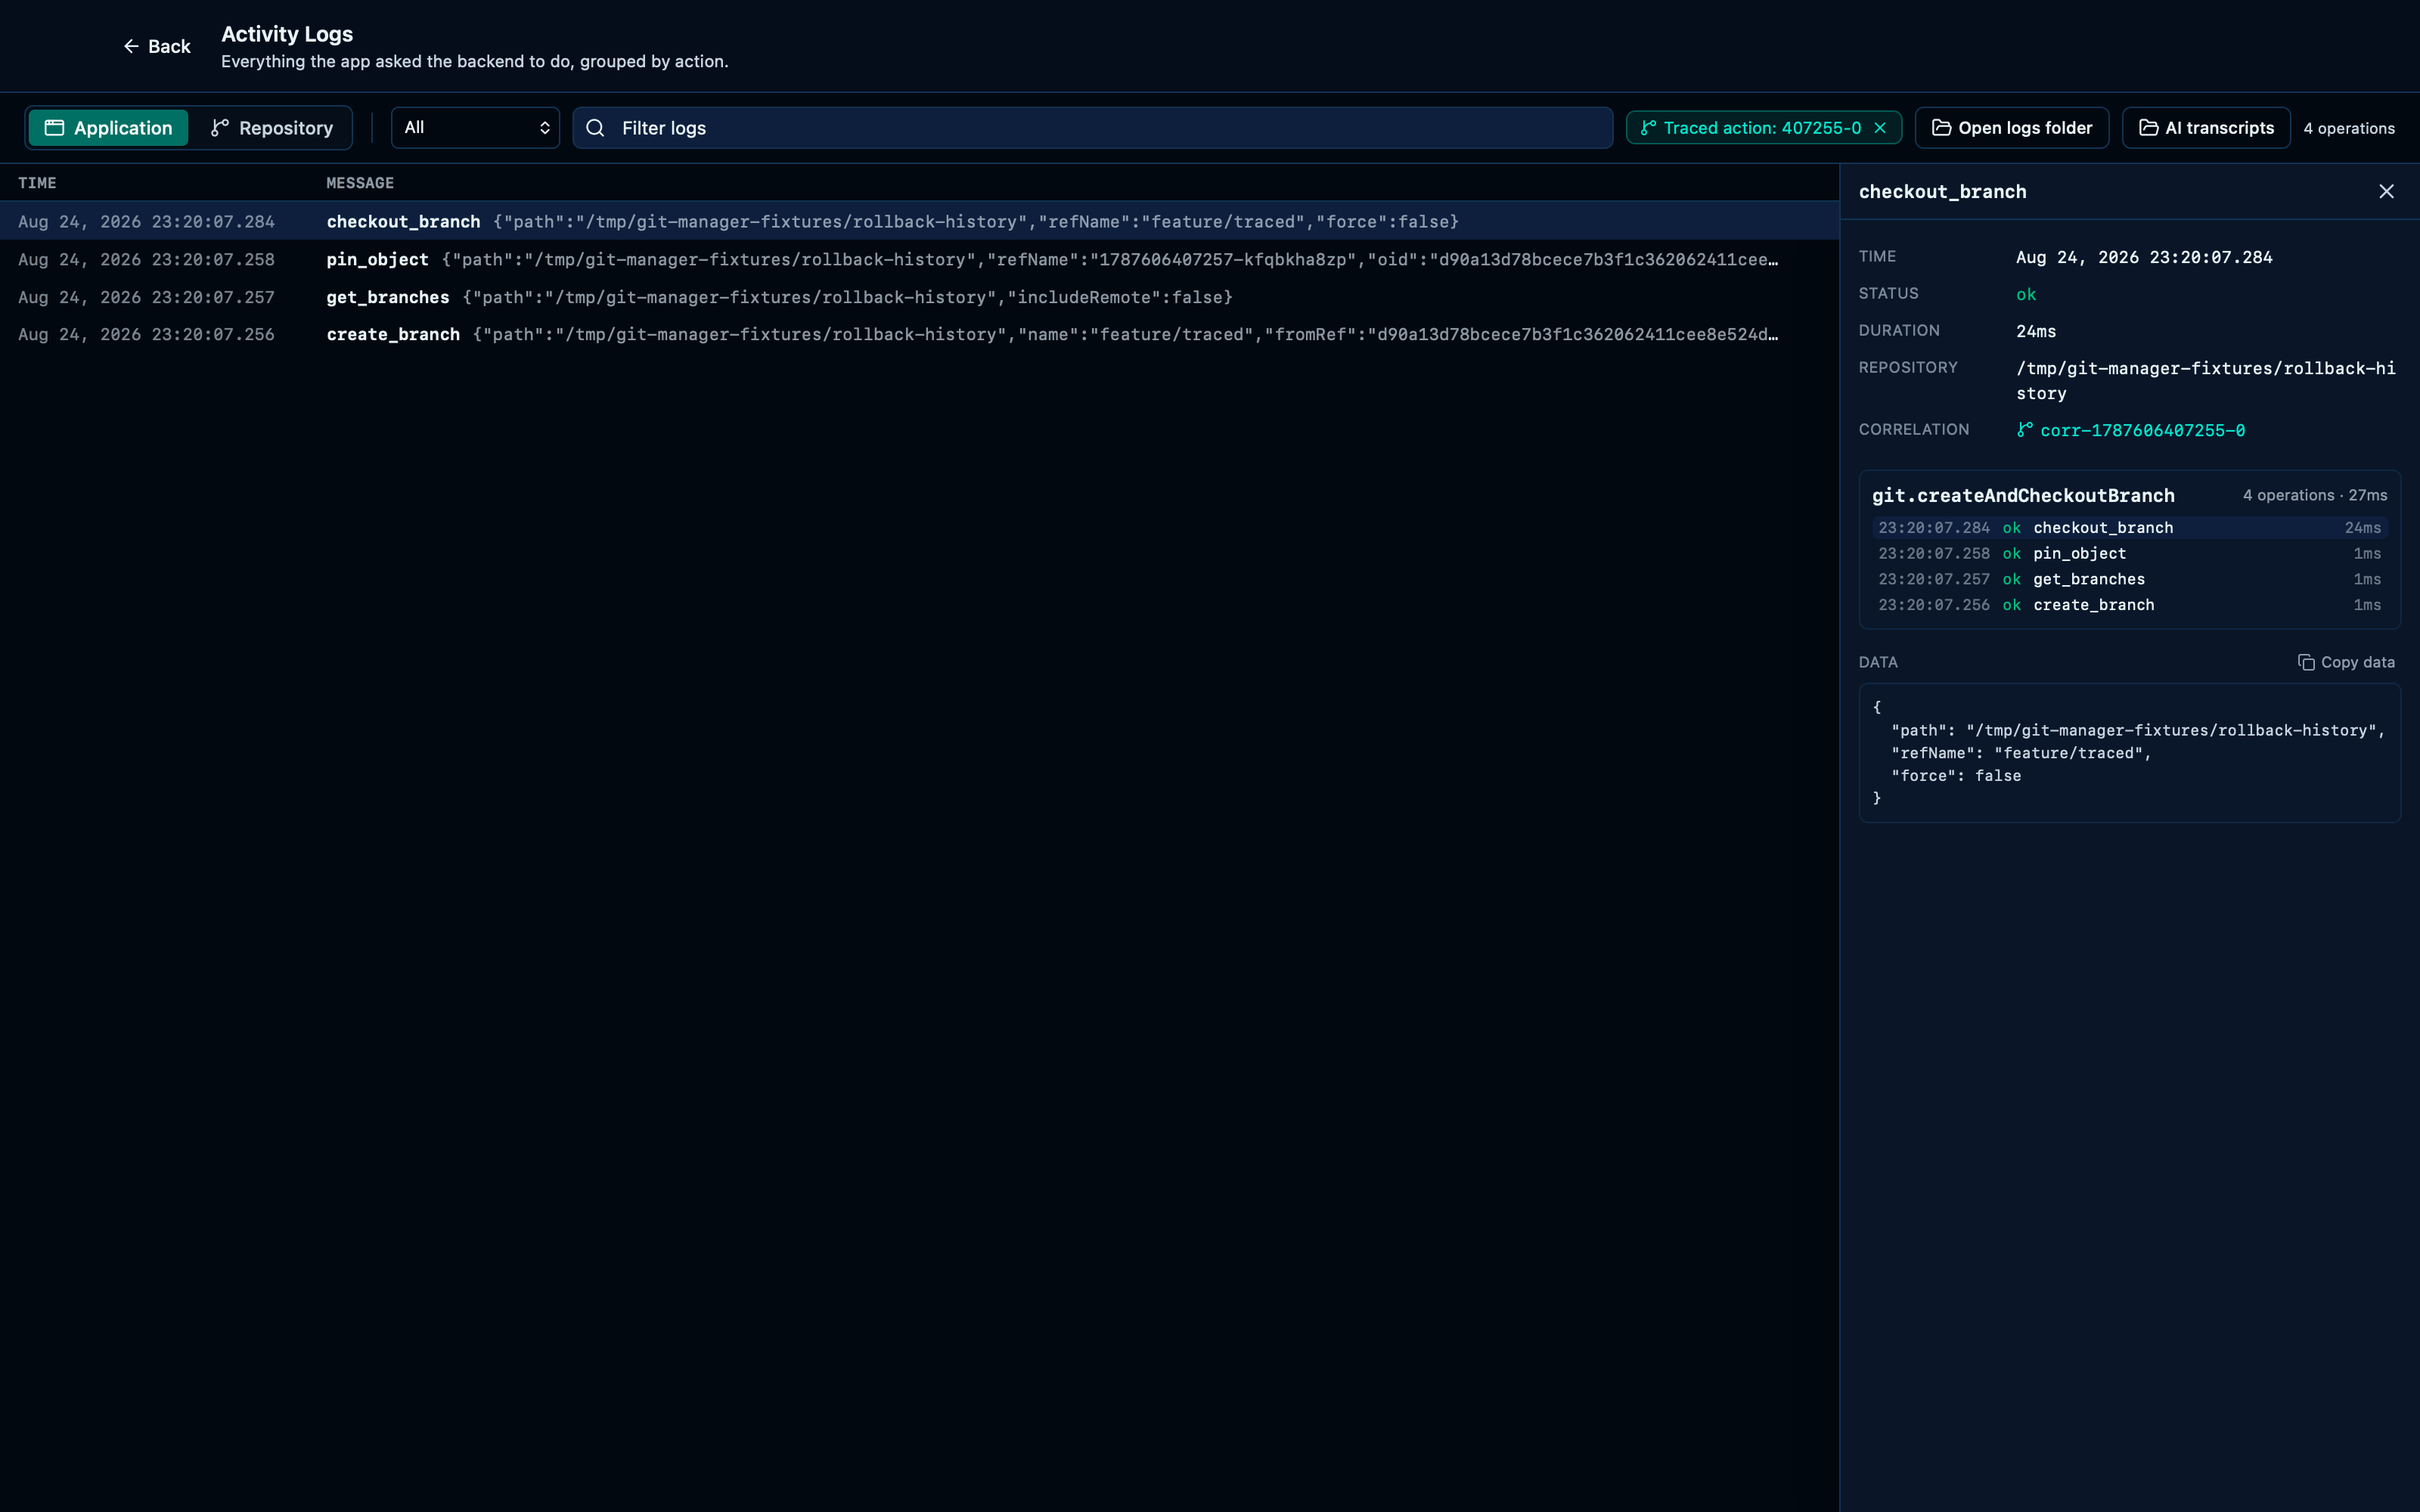
Tracing a multi-step action narrows the log to just its own operations
Creating and checking out a branch is one user gesture but two backend calls sharing a correlation id — the trace chip narrows the stream down to just those, hiding everything else the app did around it.
Captured from the running app by this scenario.
Do this
- Select the
HEAD~1commit in the graph - Open the command palette
- Run the command palette action
commit-branch - Enter the branch name
feature/traced - Confirm the branch creation
- Open the activity logs
- Open the
checkout_branchactivity log entry - Trace the activity log entry
- Clear the activity log trace
You should see
- The create branch dialog is shown
- The branch
feature/tracedexists - The activity trace chip is shown
- The activity log shows a
create_branchentry - The activity log shows a
checkout_branchentry - The activity log does not show a
get_repo_statusentry - The activity trace chip is not shown
- The activity log shows a
get_repo_statusentry
This page is generated from apps/e2e/features/activity-log.feature, the end-to-end test that drives the feature it describes.